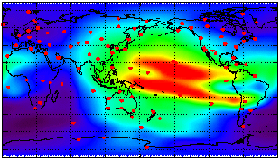
A representative global map of vertical total electron content (TEC) is shown here plotted as a function of local time and geographic latitude. It reproduces several features of the global distribution: the peak TEC values at low latitudes and the diurnal variation that is maximum around 2 pm local time, decaying to a minimum just prior to sunrise. A TEC depletion at about 60 degree latitude in the local time range 21:00-02:00 is in the location for the mid-latitude trough. The characteristic double-hump structure of the equatorial anomaly appears at low latitudes, and has a curved projection relative to loci of fixed geographic latitude, since the magnetic pole is offset from the geographic pole.
