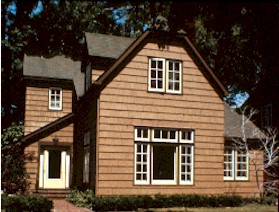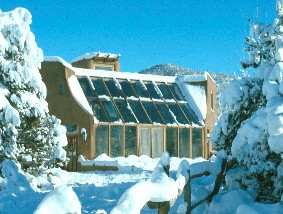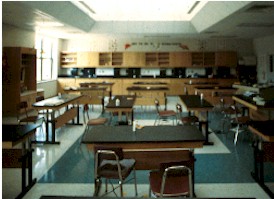
Fig. 3: Durant School
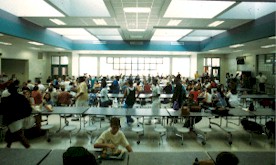
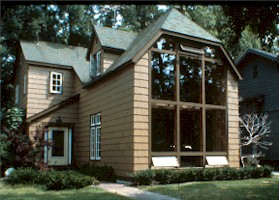
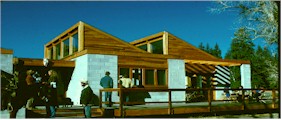
Fig. 4: Durant
School
ENERGY-10 is the software component of Designing Low-Energy Buildings with ENERGY-10, a collaborative project of the National Renewable Energy Laboratory’s Center for Buildings and Thermal Systems, the Sustainable Buildings Industry Council, Lawrence Berkeley National Laboratory, and the Berkeley Solar Group.
ENERGY-10 removes a major barrier to energy-efficient building design.For years we have heard about buildings that use half the energy of conventional buildings, provide a superior indoor environment, and cost no more to build. These include offices, schools, mental health facilities, post offices, banks, churches, and houses. Detailed monitoring of several of these buildings confirms their excellent performance. Post-occupancy evaluations clearly indicate that occupants love these buildings. People often comment on the delightful nature of their bright, daylit interior. If these buildings are so great, why don't we see more of them? One answer is that they used to cost more to design. In addition, many architects lack the analysis tools required to accurately predict a building's comfort and performance before construction.
The solution to these problems is ENERGY-10, a computer program that takes the drudgery and uncertainty out of performance analysis by making it fast, easy, fun, and accurate. The program uses a process called simulation, which means calculating in advance how the building will operate hour by hour throughout an entire year, using weather data recorded near the building site. For years, NASA has used simulation routinely to plan all of its space missions. Now building designers can use similar techniques to plan their buildings. Architects who had waited years for this software hailed its development.
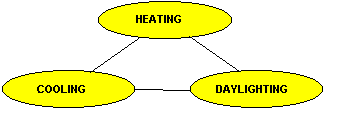
Energy-efficient buildings make extensive use of daylighting, bringing natural sunlight into the interior through high windows and special apertures called light shelves and roof monitors. These techniques were in common use a century ago. They eliminate glare because beam sunlight is diffused evenly throughout the room.
Daylighting allows building occupants (or, better yet, automatic controls) to dim or turn off heat-generating electric lights. This saves by reducing the amount of electricity used for both lighting and air conditioning. Savings that result from reducing the size of cooling equipment can more than pay for the modifications required. With good design, heating, cooling, and lighting costs can all be reduced. The ENERGY-10 program guides the designer to correct solutions, providing sound energy-efficient designs.
Ultimately, occupants are the major beneficiary of these buildings. Many
occupants of low-energy buildings have already demonstrated lower rates of
absenteeism, higher productivity, and more relaxed and contented feelings. The
test scores of students in several North Carolina schools (figs 1–4) are 5%–21%
higher than those of students in schools without natural light. Mental health
patients have shown higher rates of recovery and less stress when treated in
low-energy buildings. The economic effects of these ancillary benefits
complement the savings from lower utility bills.
How Is This Software Different?
Computer simulations for buildings have been around for years. What is different
about ENERGY-10? The answer lies in two of ENERGY-10's
unique features: AutoBuild and Rank.
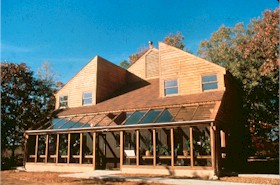
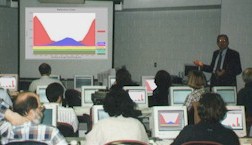
Fig. 3: Durant School
|
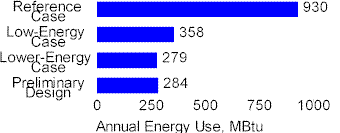
NREL has developed a way to define and evaluate a building before it's been designed. This procedure, called AutoBuild, is programmed into ENERGY-10 and can be done faster than it can be explained. The idea is to describe the building based on a few pieces of information that are known in the predesign phase of a project: location, total square footage, and use category (for example, office, warehouse, school, residence). Additionally, the number of stories and type of heating, ventilating, and air-conditioning (HVAC) system may be known. Starting from these five inputs, a plain rectangular (or shoe-box) building can be defined. This is called a reference case (or base case).
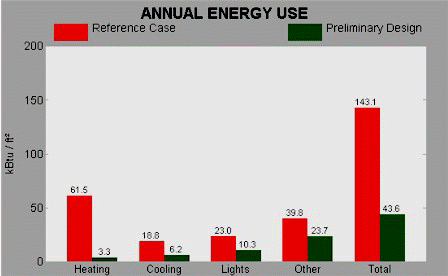
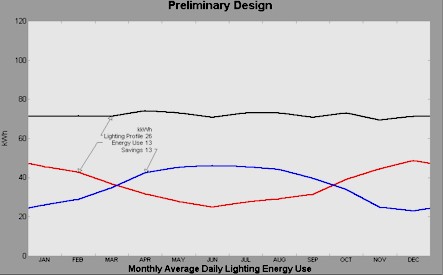
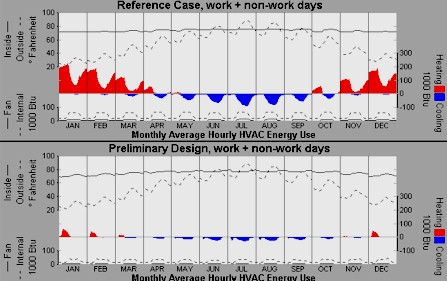
The next step is to perform an energy analysis of the reference case. The results will be enlightening, especially if you are new to energy analysis. Energy use and energy cost are determined, as well as how these are divided between heating, cooling, lights, fans, and other uses, such as plug loads. The results are quantitative and graphic. You can explore the output graphics to determine how big the peak loads are and when they occur. Most importantly, you gain insight.
The AutoBuild wizard goes one step further. It generates not just one building description, but two. The second building is derived from the reference case. It is the same rectangular shoe box but with a potpourri of energy-efficient strategies applied. These might be added insulation, energy-efficient lights, daylighting, passive solar heating, and extra mass for heat storage (the user gets to select the strategies). This second building, called the low-energy case, is also evaluated and the results are displayed alongside the reference case results. This shows the potential for savings from the selected strategies. Again, you can delve into the hourly graphs to see just why and when the savings are being made.
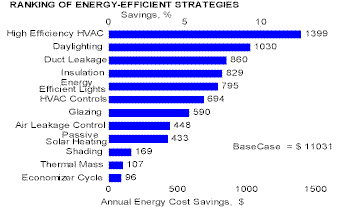
Another unique feature of ENERGY-10 is Rank, which automates the process of sequentially applying several energy-efficient strategies of potential interest, evaluating their consequences, and ranking the results. NREL strongly suggests that these steps be carried out at the beginning of each project to save time later on. The designer can enter the preliminary design phase knowing the energy strategies that are likely to be most important and effective.
As the design proceeds, the designer should modify the low-energy case building description (that AutoBuild generated) to represent the building that is actually being contemplated. ENERGY-10 is based on the principle that everything is defaulted and everything can be changed (including the defaults). This saves time in setup, yet provides great flexibility in defining the building. It also allows the user to evaluate the consequences of decisions as the design evolves. In the end, the architect can present the design to the client while feeling confident that he or she has designed a comfortable, energy-efficient building. The architect also will know that the future owner and occupants will appreciate the lower utility bills as well as the high quality of the indoor environment.
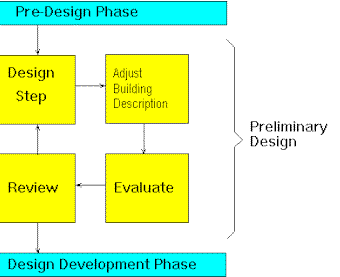
ENERGY-10 is designed to complement the
normal architectural design process, as shown in the diagram.
Predesign Preliminary Design Keeping a Record As the design evolves, the results for each scheme are saved using
the Keep feature of ENERGY-10. ENERGY-10
can display the results of the initial cases and the various schemes as
shown. Other results, such as annual costs or peak electric load, can
also be graphed.
In the design development phase, the user further modifies the
building description to be consistent with the final building design. ENERGY-10
results are compared with the original two reference buildings and with
the performance goals established in the schematic design. Fine-tuning
design can be done and design adjustments can be made at this point.
In the construction documents phase, the user develops specifications
to ensure that each element of the building and each piece of equipment
will meet the design parameters assumed in the energy evaluation.
Perspective We strongly recommend you read Designing Low-Energy Buildings,
an excellent general guide to the integration of energy-efficient
strategies into the design process. This guide, along with the ENERGY-10
software, are the key materials in the Sustainable
Buildings Industry Council's workshops on low-energy buildings.
|
|
Automated
Tasks AutoBuild generates buildings in a snap. In the first
step, provisional building data, such as wall heights and lengths and
thermostat set points, are calculated based on four inputs you supply.
You can edit these provisional values or not, as you choose. In the
second step, the AutoBuild wizard generates two complete building
descriptions, a reference case and a low-energy case. As the two
building descriptions are being generated, hundreds of numbers are
defaulted into the buildings' databases. However, you always have
complete freedom to adjust any parameter.
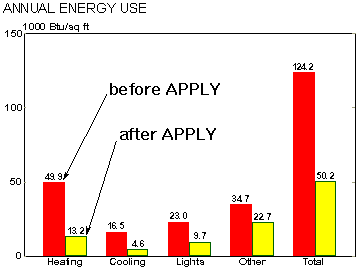
Rank applies strategies one at a time, whereas Apply
applies several strategies at once. Rank first simulates the
unmodified building and then applies the first strategy selected, does a
simulation, saves some results, and unapplies the strategy. It proceeds
automatically through all selected strategies in the same way. At the
conclusion, it displays the results, ranked according to annual energy
use. The user can then select other ranking criteria. Rank
results are saved as part of a variant. Rank leaves the original
building unmodified.
ENERGY-10 runs under Windows. The
Windows user interface is both intuitive and powerful. The building
description is contained in dialog boxes. Building parameters are all
defaulted during AutoBuild, but they can all be changed later. A
powerful feature of Windows is that the output graphics can be copied to
the Clipboard and subsequently pasted into another application, such as
a word processor or presentation software.
Extensive on-line help is available. The ENERGY-10
user is supported by comprehensive, context-sensitive help screens. Many
"how-to" sections detail common procedures. Extensive
background descriptions are given. When possible, Help relies on
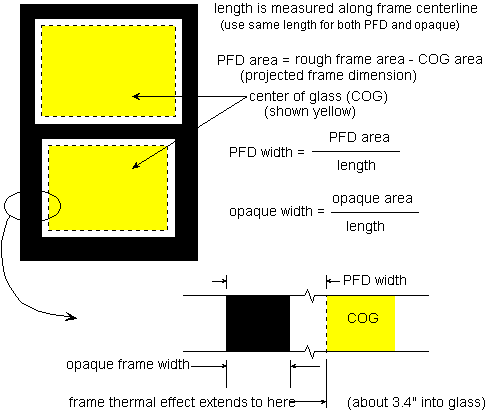
graphical information. An example is the description taken from Help
showing how a building's windows are modeled as center-of-glass and
frame, relying on Lawrence Berkeley National Laboratory's Window-4
computer program results.
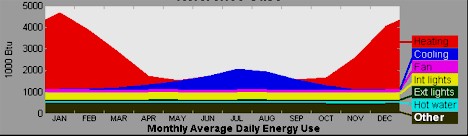
Graphic
Output
For other graph options, see Simulation
Analysis. These graphs show up better on the ENERGY-10
screen than in this web page, where they have been changed from their
original vector representation to a raster (JPEG) representation, with
some inherent loss of detail. The detail is retained when the image is
pasted into a word-processor.
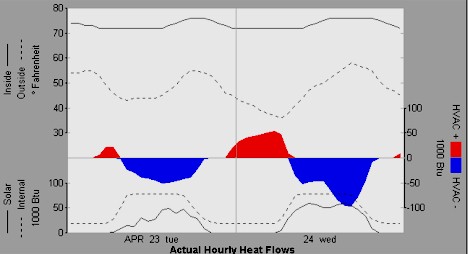
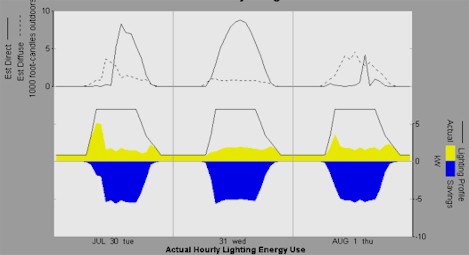
Simulation
Analysis The graphs generated by ENERGY-10 show
typical simulation results. The advantage of simulation analysis is that
it provides a reasonably realistic picture of how an actual building
would perform, assuming that it is constructed and operated in
accordance with your specifications and your suppositions regarding
operational behavior, such as thermostat settings, HVAC control
settings, and internal gains.
The simulation analysis in ENERGY-10
accounts for a detailed evaluation of solar gains through windows, heat
flowing into and out of walls, thermal storage in all building
materials, and HVAC performance. The simulation is performed for an
entire year, summing hourly energy consumption into monthly totals,
determining monthly costs, and then annual totals. It is a little like
monitoring a building before it is constructed.
The daylighting analysis divides the building into five lighting
zones and employs the split-flux method. The thermal analysis is done
using a thermal-network mathematical modeling approach. HVAC analysis is
quasi-steady state.
|
Bibliography
Balcomb, J. Douglas (1999). "Using ENERGY-10,
to Design Low Energy Buildings". A summary report that describes ENERGY-10,
and presents a detailed worked example carrying a particular building
from pre-design through preliminary design. 20 pp. (PDF
Format, 118KB)
Balcomb, J. Douglas (1999). "ENERGY-10,
Slide Show". A graphic presentation of the ENERGY-10 program,
adapted from a PowerPoint presentation. 21 slides. (PDF
Format, 966KB)
Balcomb, J. Douglas; Beeler, George (1998). "Designing
Low-Energy Buildings with ENERGY-10."
Proc. Solar '98 (24th Passive Solar Conference), American Solar
Energy Society, June 15-18, 1998, Albuquerque, NM. Shows ENERGY-10
as it would be used in the design of the Environmental Technology Center
at the Sonoma State University. (PDF
Format, 73KB)
Balcomb, J. D. (1998). "The Coming Revolution in Building
Design." Proc. PLEA '98, Passive and Low-Energy
Architecture, Lisbon, June 1-3, 1998. Lecture upon acceptance of the
Passive and Low Energy Architecture Lifetime Achievement award. The
paper is a general discussion of the huge benefits of low-energy
building design, the critical role of design tools, and the impediments
and solutions to wide-scale implementation. (PDF
Format, 59KB)
Balcomb, J. Douglas (1998). "ENERGY-10,
Designer Friendly Simulation for Smaller Buildings." Building
Performance, Issue 1, Spring 1998, Journal of the Building
Environmental Performance Analysis Club, UK. A general overview.
Balcomb, J. Douglas (1997). "ENERGY-10,
A Design Tool for Low-Energy Buildings." Proc. Building
Simulation '97, International Building Performance Simulation
Association, Sept. 8-10, 1997, Prague, Czech Republic. A technical
overview. (PDF
Format, 81KB)
Balcomb, J. Douglas; Prowler, Donald (1997). "ENERGY-10,
The Making of a Design Tool." Proc. Solar '97 (22nd Passive
Solar Conference), American Solar Energy Society, April 25-30, 1997,
Washington, D.C. Reviews the initial development of the Designing
Low-Energy Buildings with ENERGY-10
package. (PDF
Format, 58KB)
Balcomb, J. Douglas (1997). "ENERGY-10,
A Design Tool Computer Program for Efficient Houses." Proc. 1996
EBBA Excellence in Building Conference, Energy Efficient Building
Association, November 14-17, 1996, Minneapolis, MN. Shows how ENERGY-10
can be used in residential design. (PDF
Format, 81KB)
Balcomb, J. Douglas; Crowder, R. Scott (1995). "ENERGY-10,
A Design Tool Computer Program for Buildings." Proc. Solar '95
(20th Passive Solar Conference), American Solar Energy Society, July
15-20, 1995, Minneapolis, MN. The original paper published on ENERGY-10.
Judkoff, Ron; Neymark, Joel (1995). "International Energy Agency
Building Energy Simulation Test (BESTEST) and Diagnostic Method."
National Renewable Energy Laboratory. BESTEST is designed to help
programmers develop reliable software to predict energy performance in
buildings, and to assure building designers that a particular software
package is accurate and appropriate for their usage.
Weather Data Workshops |