Carbon dioxide emissions from the consumption of fossil fuels
| Consumption of fossil fuels is the
dominant source (>99%) of greenhouse gases in Rhode Island. Because of
the importance of this source and in order to give a more complete
picture of the trends in fossil fuel emissions, this section of the
inventory was compiled over a longer time period than required by the
Workbook. Emissions data for the consumption of all fossil
fuels were compiled for the 11-year period of 1986 – 1996, based, with
one exception, on the Energy Data Report for Rhode Island for 1996,
provided by the Energy Information
Administration (EIA). The one exception is for emissions from
electric utility emissions. For these, the EIA data were found to be
in error, and data obtained from the RI Public Utilities Commission
was used instead, as reported in the section on
Electricity Generation. The EIA reports fuel consumption by
sector (residential, commercial, industrial, transportation and
electric utility), and within each sector by fuel type. Following
Workbook procedures, these data were converted into metric tons of
carbon equivalents (MTCE) for all emissions. The Fossil Fuel Emissions Table lists emissions by sector for 1990 and 1996, and accompanying figures show the eleven-year trends in emissions by sector. Note that 79% of the increased emissions between 1990 and 1996 result from an order of magnitude increase in emissions from electric utilities. Note also that this section of the inventory reports only carbon dioxide emissions. Emissions of nitrous oxide and methane (from mobile sources) are reported separately. |
Fossil Fuel Emissions by Sector, in MTCE
|
1990 |
1996 |
1990-96 |
||
|
Sector |
MTCE |
MTCE |
MTCE Increase |
Increase |
|
Residential |
556,441
|
697,861
|
141,420 |
25% |
|
Commercial |
368,972 |
482,846
|
113,874 |
31% |
|
Industrial |
152,399 |
190,948
|
38,549 |
25% |
|
Transportation |
1,020,868 |
1,071,085 |
50,217 |
5% |
|
Electric Utility |
120,829 |
1,430,669 |
1,309,840 |
1084% |
|
Total |
2,219,509
|
3,873,409 |
1,653,900 |
75% |
| Note that the emissions from fossil fuel combustion listed in the table above are only those emitted directly in Rhode Island, and specifically do not include indirect emissions from the generation of electricity consumed in Rhode Island, but generated outside of the state. Most greenhouse gas emission reduction strategies will need to consider both direct and indirect emissions, and for this purpose, the following chart reports total emissions - i.e. emissions from the generation of electricity consumed in the various sectors are included in this chart.. |
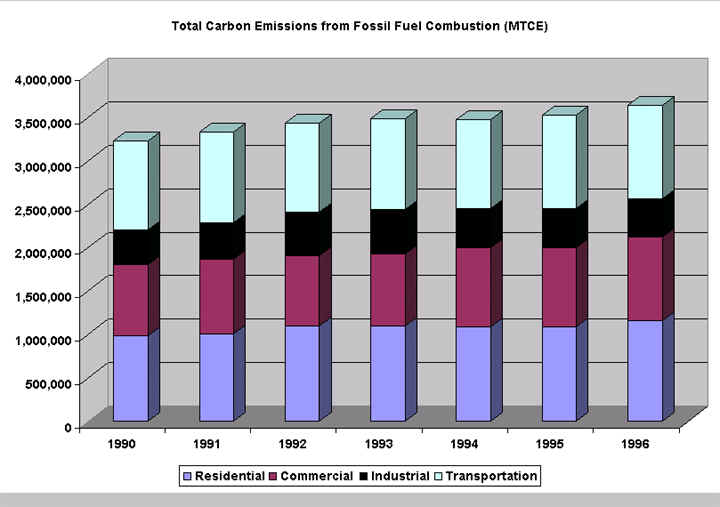
| Emissions for 1990 have particular
significance, because that is the base year chosen for setting
emissions reduction goals. The figure shows that 1990 emissions were
significantly lower than any other year in the ’86 – ’96 period, a
result of a temporary dip in distillate fuel consumption and a
long-term decline in residual fuel use. (See the Emissions by Fuel
Type figure). Emissions increases after 1990 result from a strong
increase in use of natural gas in the utility sector and a return to
pre-1990 levels in distillate fuel use.
Although data obtained from the RI Public Utilities Commission, together with certain reasonable assumptions, allowed the estimation of carbon dioxide emissions from the generation of electricity consumed in the various sectors, we did not have the information we would have needed to identify the fuel types used for this generation. Therefore, we have used data provided by the EIA, which we know in at least one case (natural gas supplied to the industrial sector) to be low, because they were the only data available. As expected, the total emissions shown in the following charts are therefore somewhat lower than those in the preceding chart. . |

| The dip in distillate fuel use in the residential sector in 1990 (14.9 TBTUs, compared to an eleven-year average of 18.6) seems to be the result of an abnormally low number of heating-degree days for that year. (See Annual Degree Days, 1986 – 1996) |
| The only comprehensive source of fossil
fuel consumption data available to us was that provided by the EIA.
EIA data are compiled from surveys of the owners of distribution
systems, and apparently are subject to significant uncertainty. In the
one case where we were able to obtain independent reliable data
against which EIA data could be cross-checked (natural gas consumption
by the industrial sector), the EIA data were found to be seriously in
error. We therefore caution that the data supplied in this section may
have considerable uncertainty – however the EIA data are all that are
available, and there is no alternative to using them. Analysis of emissions from fossil fuel combustion for the period 1986 - 1996 Because of the dominance of the inventory by emissions from fossil fuel combustion , we have prepared a variety of figures, showing the various combinations of fuel types and emissions sources. The charts below are linked to larger versions in the Fossil Fuel appendix. They show the breakdown by fuel type (Distillate Oil, Residual Oil, Gasoline, Diesel Fuel, Natural Gas) within four sectors of the economy (Residential, Commercial, Industrial, Transportation) (the right column) and within three fuel types, a breakdown by economic sector (the left column). Again, please note that emissions from the generation of electricity are not included in these charts.
|
|
|
|