| Energy in the
United States: 1635-2000 |
|
|
|
|
Petroleum |
|
| It is hard to imagine a world
without petroleum, partly because humans have been using it since at least
3000 BCE. Mesopotamians of that era used "rock oil" in architectural
adhesives, ship caulks, medicines, and roads. The Chinese of two millennia
ago refined crude oil for use in lamps and in heating homes. Seventh-century
Arab and Persian chemists discovered that petroleum's lighter elements could
be mixed with quicklime to make "Greek fire," the napalm of its day. From
these scattered uses, petroleum has come to occupy a central place in modern
civilization. Today petroleum still finds applications in buildings,
shipping, medicine, roads, and warfare. It is crucial to many industries,
including chemicals and agriculture. Above all, it dominates the world
energy scene. |
|
| "Great excitement ensued,"
according to the account in the 1883 edition of Mineral Resources of the
United States. Drake's discovery ignited an oil boom, which was fed by
strong demand for lighting fuel and lubricants. Over the next four decades
the boom spread to Texas and California in the United States and to Romania,
Baku (in Azerbaijan), Sumatra, Mexico, Trinidad, Iran, and Venezuela.
Overproduction temporarily drove prices down, but the rapid adoption and
spread of internal combustion engines in the late 19th century helped create
vast new markets. With only temporary interruptions, world petroleum
consumption has expanded ever since. |
|
|
|
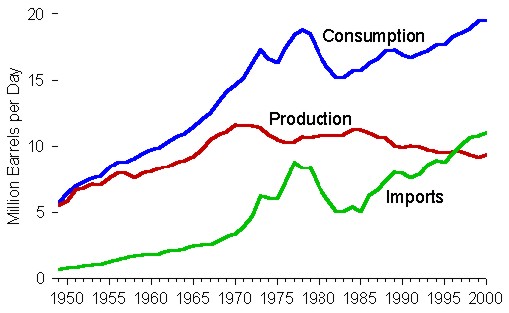
| Until the 1950s the United States
produced nearly all the petroleum it needed. But by the end of the decade
the gap between production and consumption began to widen and imported
petroleum became a major component of the U.S. petroleum supply (Figure 11).
Beginning in 1994, the Nation imported more petroleum than it produced.
|
|
| |
|
| Figure 11. Petroleum Overview
|
|
|
|
|
|
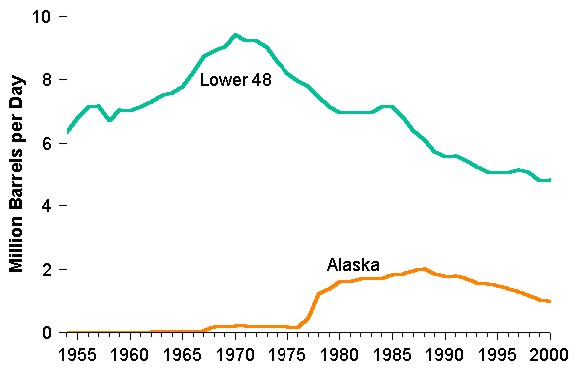
| Crude oil production in the lower
48 States reached its highest level in 1970 at 9.4 million barrels per day
(Figure 12). A surge in Alaskan oil output at Prudhoe Bay beginning in the
late 1970s helped postpone the decline in overall U.S. production, but
Alaska's production peaked in 1988 at 2.0 million barrels per day and fell
to just under 1.0 million barrels per day per well in 2000. |
|
| |
|
| Figure 12. Lower 48 and Alaskan
Crude Oil Production |
|
|
|
|
|
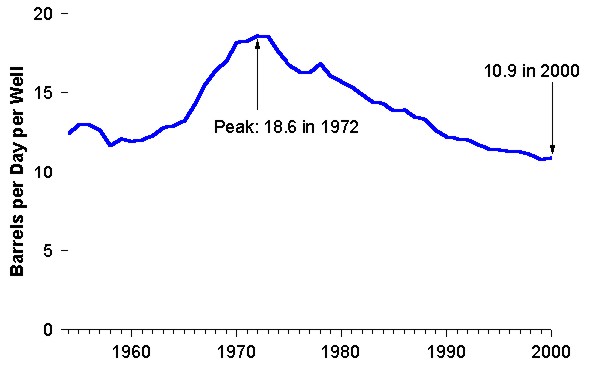
| Another index of the Nation's
petroleum output is oil well productivity, which fell from a high of 18.6
barrels per day per well in 1972 to 10.9 barrels per day per well in 2000
(Figure 13). |
|
| |
|
| Figure 13. Oil Well Productivity
|
|
|
|
|
|
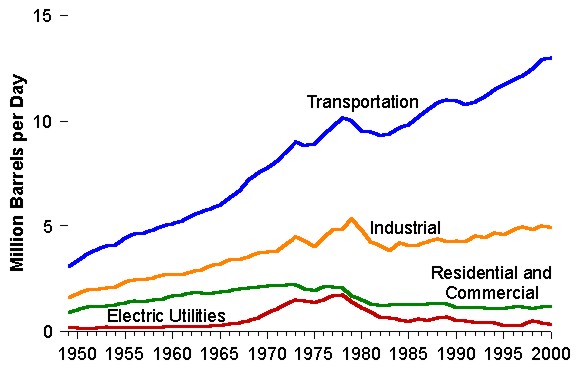
| U.S. petroleum consumption rose
annually until 1973, when the Arab OPEC embargo stalled the annual increases
for two years. The increases then resumed, raising consumption to 18.8
million barrels per day in 1978, before rising prices drove it down to a
post-embargo low of 15.2 million barrels per day in 1983. Consumption began
to rebound the following year and was boosted by plummeting crude oil prices
in 1986. By 2000 it had reached 19.4 million barrels per day. Of every 10
barrels of petroleum consumed in the United States in 2000, more than 4
barrels were consumed in the form of motor gasoline. The transportation
sector alone accounted for two-thirds of all petroleum used in the United
States in 2000 (Figure 14). |
|
| |
|
| Figure 14. Petroleum Consumption
by Sector |
|
|
|
|
|
| To meet demand, crude oil and
petroleum products were imported at the rate of 11 million barrels per day
in 2000, while exports measured 1 million barrels per day. Between 1985
(when net imports fell to a post-embargo low) and 2000, net imports of crude
oil and petroleum products more than doubled from 4.3 million barrels per
day to 10 million barrels per day. The share of U.S. net imports that came
from OPEC nations reached 72 percent in 1977, subsided to 42 percent in
1985, and stood at 51 percent in 2000. Total net imports as a share of
petroleum consumption reached a record high of 52 percent in 2000. The five
leading suppliers of petroleum to the United States in 2000 were Canada,
Saudi Arabia, Venezuela, Mexico, and Nigeria. |
|
|
|
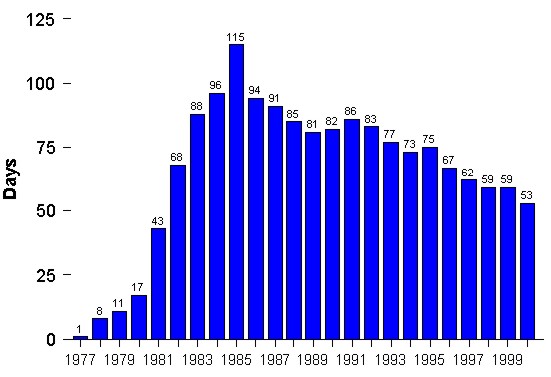
| To protect against supply
disruptions, the United States began to create a Strategic Petroleum Reserve
in the late 1970s. By 1985 the reserve's holdings reached 493 million
barrels, which would have provided enough crude oil to replace about 115
days' worth of net petroleum imports that year. In 2000, the reserve held
541 million barrels of crude oil. Due to the increased rate of imports,
however, that amount would replace only 53 days' worth of net imported
petroleum (Figure 15). |
|
| |
|
| Figure 15. SPR Stocks as Days'
Worth on Net Imports |
|
|
|
|
|
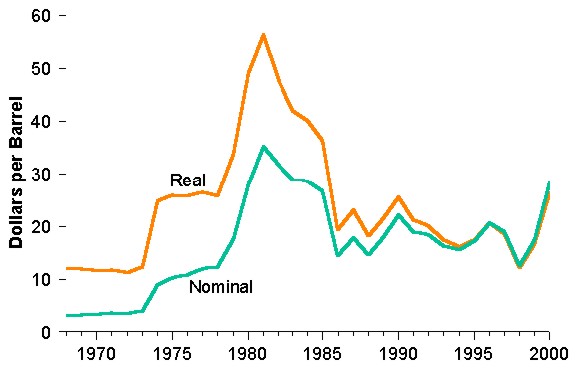
| U.S. petroleum prices rose steeply
between 1998 and 2000. Refiners' acquisition costs for crude oil in 2000
(composite of domestic and imported oil costs) averaged $28.23 per barrel, a
16-year high. When adjusted for inflation, the cost was $26.40 per barrel
(chained 1996 dollars), 58 percent above the previous year's cost--but still
53 percent below 1981's record of $56.50 per barrel (Figure 16).
|
|
| |
|
| Figure 16. Crude Oil Refiner
Acquisition Cost |
|
|
|
| Obtained from
http://www.eia.doe.gov/emeu/aer/eh/frame.html |
|