Waste in a land of plenty - Solid waste
generation and management in the US
|
| The US generates the
highest amount of waste per person in the world and continues to
rely on landfilling at the expense of recycling and
waste-to-energy, according to the latest in an annual series of
national surveys on municipal solid waste generation and
management |
| Nickolas
J. Themelis and Scott M. Kaufman |
|
In the frontier mentality that has evolved over the centuries in America, the
abundance of available space has been a reassuring constant. When things get too
crowded or too uncomfortable, there is always greener grass to move to, rebuild
on and start all over again. This has also been the story of waste disposal in
the US: there has been boundless room to grow, with plenty of extra land to dump
the by-products. It is for this reason that waste - the consequence of the
unprecedented economic expansion during the 20th century - has been for the most
part ignored.
This began to change with the birth of modern American environmentalism in
the 1970s - somewhere along the line, people began to speak of 'reduce, reuse,
recycle' and it became fashionable to 'divert' waste from landfills. Crude
metrics such as recycling and diversion rates were instituted by federal and
local government as a way of measuring the progress made. Missing from this
picture, however, has been a coherent methodology for total accounting of the
use and ultimate fate of resources.
As people began to equate recycling with environmental stewardship, the ideal
overcame the reality. States would mandate recycling rates with little
consideration of whether there were markets for a large fraction of the
'recycled' materials. Others would celebrate '50% diversion' without mentioning
the corollary jump in waste generation. When media attention was devoted to
issues of waste management, it took on sensationalist tones (the 'New York
garbage barge') or vague notions of a prescribed national recycling rate. Lost
in this discussion were matters of substance - 30% of how many tonnes, and what
are the environmental impacts of dealing with the other 70%?
Though these kinds of questions usually went unanswered, it was important
that waste came to be an issue of consequence - at least among some of the
population. Once this happened, it seemed time to begin truer accounting of how
the US was managing a previously neglected resource.
Measuring waste in the US
Motivated by the principles of industrial ecology, academic institutions have,
in recent years, become involved in the study of integrated waste management. In
2002, the Earth Engineering Center (EEC) of Columbia University conducted a
comparison of waste generation and disposal in two states (New York and
California) and two coastal 'megacities' (New York and Los Angeles).1
One finding was that, when the data from the two states were scaled up to the US
as a whole, the generation of municipal solid waste (MSW) was much higher than
that reported annually by the US Environmental Protection Agency (USEPA).2
On the other hand, the EEC data were much closer to those reported by BioCycle,
a US journal specializing in composting and organics recycling that has been
conducting an annual survey for a number of years. This survey is known as the
State of Garbage (SOG) survey. Following EEC's 2002 study, BioCycle invited the
Center to collaborate on its 2002 SOG survey of the US.3
Data collection for the 2002 survey
Earlier SOG surveys had involved sending a questionnaire to the waste management
departments of the 50 states. For the 2002 survey (14th SOG), EEC reworked this
questionnaire, substituting quantitative questions for previously qualitative
ones. The goal was to persuade states to report waste numbers using tonnages
only, with any percentages - for recycling, landfilling, waste-to-energy (WTE),
etc. - being calculated subsequently by EEC. Extra questions were added to the
questionnaire that made cross-comparison of the data provided by each state
possible.
|
In this way, we were able to correct for different methods of
collecting data among states. For example, California includes
construction and demolition (C&D) wastes in its MSW reports. As this
is typically a waste stream with higher recycling rates, combining it
with the MSW serves to increase the state's overall 'diversion rate',
that is, solid waste that is not sent to landfill.
Of the 50 states, 47 responded, representing 98% of the US
population, and provided varying degrees of detail and accuracy. The
differences can be partly attributed to the fact that not all state
governments monitor waste disposal closely. In general, states that do
track wastes closely fall into one or both of the following two
categories:
|
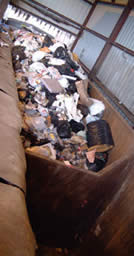
 |
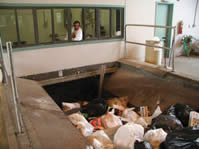
Waste to be compacted for processing. PHOTOS: N. MITOS, THERMOELEKTRON
|
- relatively densely populated states, usually in the Northeast,
where traditionally easy solutions (landfilling) are becoming more
problematic
- 'environmentally conscious' states like California, New York,
Minnesota and Oregon, where there is generally greater public
awareness and initiative to manage waste in sustainable ways
|
| It
is time to begin truer accounting of how the US was managing a
previously neglected resource |
States were asked to categorize waste by type (residential, commercial,
industrial C&D, exported, imported) and by tonnages disposed (recycling,
composting, WTE, landfilling). Once all the information was received, much
effort was put into ensuring that materials included in one state's definition
of MSW would also be included in the calculations for all states.
For the purposes of the 14th SOG study, MSW generation was defined as
follows:
| MSW generated |
= |
[tonnes recycled] + [tonnes WTE] + [tonnes landfilled] + [tonnes
exported] - [tonnes imported] |
Results of the 2002 survey
Table 1 summarizes the results of the 14th SOG survey and provides a comparison
with data from the survey carried out in 2001 by Franklin Associates for the
USEPA.2 The USEPA numbers were lower by about
120 million tonnes for generation and by 100 million tonnes for landfilling.
According to the SOG survey, the average generation of MSW in 2002 was 1.19
tonnes per capita. This is the highest rate reported by any nation and it is
nearly twice the reported generation rates for the EU and Japan.
| TABLE
1. Generation and fate of MSW in the US |
| |
14th
SOG survey1 |
USEPA
2001 survey2 |
| |
million
tonnes/year |
% |
million
tonnes/year |
% |
| Amount generated |
336 |
100.0 |
211 |
100.0 |
| Amount recycled and composted |
90 |
26.7 |
65 |
30.8 |
| Amount to WTE |
26 |
7.7 |
27 |
12.8 |
| Amount landfilled |
220 |
65.6 |
119 |
56.4 |
|
The reported recycling rate was 26.7%, of which about one quarter was
composted. The 26 million tonnes of MSW treated in WTE facilities represented
7.7% of the amount generated and not 13% as estimated earlier on the basis of
the much lower rate of generation reported by USEPA.
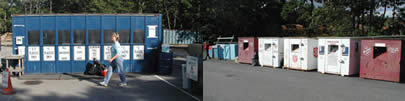
ABOVE LEFT Cans, bottles and plastics waste are collected for recycling
in Harwich, Massachusetts ABOVE RIGHT A community collection point
of clothes and donations at Harwich, Massachusetts
As explained earlier, the 14th SOG survey was based on data recorded or
estimated by the state agencies responsible for solid waste management. On the
other hand, the USEPA data were based on a 'materials flow' method that compiles
industrial production and consumption records. It then makes certain assumptions
about the lifetimes of products and materials, and of discard patterns.
According to previous SOG surveys (see Figure 1), the generation of solid waste
increased by an average of about 11 million tonnes/year between 1990 and 2000.
In contrast, the USEPA reported that the rate of growth of MSW generation over
this period increased by an average of only 3 million tonnes/year, which
corresponded to nearly 1% per year. Coincidentally, the US population during the
same period increased by about 3 million people per year, i.e. also 1%.
FIGURE 1. Comparison of SOG surveys findings with those
from USEPA 2001 survey
Figure 1 also shows the results of the 14th SOG survey, which estimated MSW
generation at 336 million tonnes. It is believed that the reported generation in
earlier SOG surveys included some C&D waste and wastes from small industrial
operations that end up in landfills. For example, the shredding of millions of
discarded automobiles generates several million tonnes of automobile shredder
residue (ASR). Despite the fact that ASR consists of over 60% combustible
plastics, it is currently disposed of in landfills in the US. In another
example, repulping of used paper generates 10%-15% of a mixed plastics and paper
residue that is also landfilled. The approach EEC took in the 2002 survey was to
make the data and methodology as transparent as possible. While it is certainly
important to try to quantify waste reduction, this was outside the scope of the
EEC study: the tonnes of waste recycled, combusted or landfilled must add up to
the tonnes of waste generated.
Implications of the survey findings
The results of our study showed that, on a per capita basis, the US generates
more MSW than any other nation. It also showed that the US relies heavily on
landfilling as the primary means of waste management. A number of factors
contribute to this situation:
- Large nationwide corporations own a substantial fraction of the contracts
with municipalities to haul and dispose of waste, as well as the landfills
to put it in.
- The relative abundance of 'open' land - especially in the West - results
in very low tipping (gate) fees for landfills. The gate fees reported (by
only a few states) in the 14th SOG survey ranged from $50 to $90 per tonne
of MSW. However, in some states, the gate fees can be as low as $20 per
tonne.
- The USEPA does publish a hierarchy of treatment methods listing
landfilling as the last resort, but it has not moved towards legislative
action such as the EU Landfill Directive, which requires near-term phasing
out of the landfilling of biodegradable materials.
Recycling in the US
The 2002 SOG survey showed that the US recycles about 27% of its MSW. This
includes organic wastes that are subjected to composting. Only 35 states
reported the fraction of recycling due to organics and wood composting, and the
average was 28% of the reported rate of recycling. If it is assumed that all 50
states compost to the same extent, the average US recycling rate in 2002 was
19.2% and the average composting rate was 7.5% of MSW (see Table 2).
| TABLE
2. Recycling, composting, WTE and landfilling rates in 2002 |
| |
Rate
(%) |
| Landfilling |
65.6 |
| WTE |
7.7 |
| Recycling |
19.2 |
| Composting |
7.5 |
| Total |
100 |
|
States report as recycled all materials recovered either by separation at
source or at material recovery facilities (MRFs). Non-recycled residues - either
those from the MRF or the plants that process the recyclables - are included and
can be substantial. For example, a 2001 study by EEC found that a large fraction
of the plastics and glass reaching three New York City MRFs was finally
landfilled due to a lack of markets.4 In
addition, the residue from repulping of used mixed paper is also landfilled. It
is therefore possible that some double counting of materials exists (as recycled
and then as landfilled) in the data reported by the states. This would reduce
the computed rates of recycling and MSW generation shown in Table 1.
Despite the obstacles, the US has come a long way over the years in advancing
recycling to the present level. Almost 50% of the population has access to
kerbside collection programmes - that's nearly 140 million people.
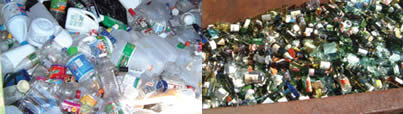
LEFT AND RIGHT Plastics and glass waste to be recycled. A 2001 study
found that a large fraction of the plastics and glass reaching three
New York City MRFs was finally landfilled due to a lack of markets.
PHOTOS: NICKOLAS THEMELIS
Waste-to-energy
As was shown in Table 1, the tonnage of MSW combusted is the only constant
between the 14th SOG survey and the USEPA study in 2001. This reflects the fact
that the WTE industry is one of the most highly regulated in the US. About 26
million tonnes of MSW were combusted in WTE plants, that is, 7.7% of the total
US MSW.
The use of WTE does not appear to affect recycling rates. The states that
sent the highest percentage of MSW to WTE facilities recycle at rates either
slightly below, slightly above, or well above average for the US as a whole (see
Figure 2).
FIGURE 2. WTE and recycling rates for six US states
WTE is used principally by more densely populated US states. In 2002, the 15
states with the highest population densities accounted for 85% of the total
tonnage sent to WTE facilities. These states have a mean population density of
163 people/km2. The ten states with the lowest population densities had a total
of just 0.4% of the WTE tonnage; the mean population density for these states is
only 4 people/km2.
FIGURE 3. Recycling and landfilling rates for US states with
the lowest population densities
Landfilling
The American West is the best demonstration of the way in which the US relies on
landfilling as a primary means of waste disposal. As land is less expensive than
in places like the North-east, landfills are somewhat easier to site and usually
have very low tipping fees. The reliance on landfilling is therefore unlikely to
diminish in the foreseeable future. In the regions with low tipping fees, both
recycling and WTE will continue to be at a significant economic disadvantage and
will therefore find it difficult to stay competitive. Figure 3 shows the
landfilling and recycling rates for low population density states that responded
to the 14th SOG survey. As stated earlier, tipping fees are as high as $90/tonne
in some states. This has led to MSW being transported across state borders and
over long distances. The 14th SOG survey reported that nearly 35 million tonnes
of MSW were imported by some states - notably Pennsylvania, Virginia, Illinois
and Michigan. However, Pennsylvania and Michigan are not states with low tipping
fees. Pennsylvania reported tipping fees of $81/tonne and Michigan $83/tonne.
The reason for the high import levels is that Pennsylvania imports millions of
tonnes of MSW from well-to-do New York City, and Michigan from Toronto. The
prevailing gate fees in Virginia and Illinois were not reported.
Conclusions
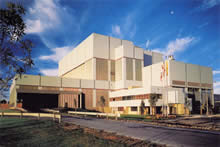
Thermal treatment facility at Stanislaus, California. The WTE industry is one
of the most highly regulated in the US. PHOTO: AMERICAN REF-FUEL
The generation of MSW in the US has continued to increase and, by any measure,
it is the highest per capita in the world. This is in line with reports that the
US has about 5% of the world's population but consumes over 20% of the materials
produced globally. As the production of waste by an ever-increasing population
generates greater volumes of MSW, it is essential to track accurately the
generation of solid wastes and their utilization for material and energy
recovery. The 14th SOG survey leads a trend towards more careful collection and
analysis of data on the generation and disposal of MSW.
Landfills and WTE facilities are required by law to keep careful records of
input and output materials. They are therefore reliable witnesses of the fate of
a large fraction of the solid waste generated. Recycling and composting
facilities should also be required by states to maintain records of the
materials received and of the residues that cannot be recycled or composted and
therefore have to be combusted or landfilled.
Waste collection at the central truck-to-rail station at Cape Cod,
Massachusetts. PHOTO: NICKOLAS THEMELIS
|
|
This study also showed that national and state agencies responsible
for waste management should be concerned with both MSW and industrial
and other residues sent to landfills instead of being recycled or used
to recover energy. A kilogram of wood that is sent to a landfill instead
of being recycled or combusted in an industrial boiler has the same
environmental impact whether it originates in a home or following
construction or demolition activity. In another example, solid waste
that goes to a waste-to-energy facility is counted as MSW, but the
resulting ash that is landfilled may not be. In all cases, society
should provide incentives for minimizing all the materials that end up
in landfills; landfilling has the highest environmental and land use
impacts of all the principal means of waste treatment and disposal.
As nations and communities move forward with analysis of different
waste streams and selecting methods of treating them, it is important to
remember that statements like 'a 50% rate of diversion' mean little if
the computed rates of waste generation are also increasing inexplicably,
as was shown to be the case for California by the 14th SOG survey.5
Manufacturers, waste haulers, waste processors, government officials
and urban planners need more specific accounting of wastes - what is
being recovered, in what quantities, and what are the inefficiencies
leading to landfilling of non-used materials. This will enable society
to better 'metabolize' these lost resources.
|
|
Although the US generates and landfills large amounts of solid
wastes, it has succeeded in recycling an estimated 90 million tonnes of
MSW, and combusts nearly as much as the EU. This is more than the total
reported by all other Organization of Economic Co-operation and
Development (OECD) countries combined.6
It is hoped that the methodology and results presented in this report
will be of use to other nations facing similar problems.
|
References
- Themelis, N. J. 'Analyzing data in State of Garbage in America, EPA
reports'. In BioCycle, January 2003, Vol. 4, No. 1, pp. 22-25.
- US Environmental Protection Agency (USEPA). Municipal solid waste in
the United States: 2001 final report. Franklin Associates for the USEPA.
July 2001. www.epa.gov/epaoswer/non-hw/muncpl/msw99.htm
- Kaufman, S. M., Goldstein, N., Millrath, K. and Themelis, N. J. '14th
annual nationwide survey of solid waste management in the United States: the
State of Garbage in America'. In BioCycle, January 2004, Vol. 45,
NO. 1, pp. 31-41.
- Themelis, N. J. and Todd, C. A. 'Recycling in a megacity'. In Journal
of Air and Waste Management Association, April 2004, Vol. 543, No. 4,
pp. 389-395.
- Themelis, N. J. and Kaufman, S. M. 'State of Garbage in America: data and
methodology assessment'. In BioCycle, April 2004, Vol. 45, No. 4,
pp. 22-26.
Themelis, N. J. 'An overview of the global waste-to-energy industry'. In Waste
Management World, July-August 2003, pp. 40-47.
References 1,3-5 are available at www.seas.columbia.edu/earth/wtert/wtertpublications.html
Nickolas
J. Themelis is the Director and Scott M. Kaufman
a Junior Research Associate at the Earth Engineering Center, Columbia
University, New York City, US.
Fax: +1 212 854 5213
e-mail: sm2108@columbia.edu
web: www.columbia.edu/cu/earth |