Get a FREE Renewables wall map when you
buy one!
This 2-for-1 offer expires July 8, 2005
Renewable Energy 2005 Wall Map
This 2-for-1 offer expires July 8, 2005
Renewable Energy 2005 Wall Map
|
U.S.
utilities will need to plan, finance, and build more than 52,000
MW of renewable capacity at an estimated capital cost of more
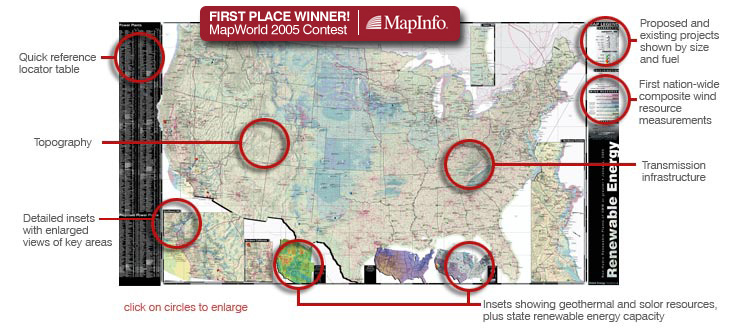
than $53 billion. Over the past 30 years, the promise of renewable energy has been touted widely, but the delivery has often fallen short. So, here in 2005, how is it different? Are renewables actually ready for prime time? Or will they generate more press releases than kiloWatt hours? How are things different? Why the optimism? Simply put, renewables are becoming increasingly reliable and cost effective. Additionally, increased concern about oil and natural gas availability and pricing, as well as ever-increasing environmental constraints, are prompting generators and utility executives to take renewable energy more seriously. And perhaps most important, customers and regulators are increasingly demanding that companies include renewables as a part of their power portfolio. The 2005 Renewable Energy wall map provides a visual framework for understanding this hot topic. The map displays: . Existing renewable energy projects . Proposed renewable energy projects . Transmission infrastructure . The industry's first comprehensive, nation-wide composite of the latest detailed wind resource measurements . Facility information (name, company, capacity, fuel, and estimated on-line date where appropriate) . Reference features of cities, counties, topography and more for a complete view of the geographic issues surrounding renewable energy development. Details Cost: $475 Size: 48" x 92" Data year: 2004 |
Special
offer is valid for phone orders only. Call 303-444-2393 (8:00 - 5:00 MT) and mention the "WINDPOWER" offer to receive free map |