| HIGHLIGHTS

In 2001, the United States consumed 113.1 billion
gasoline-equivalent gallons (GEG) to fuel passenger travel by light-duty
vehicles, a rise of 3.3 percent per year from 1994, when 90.6 billion was
consumed. That fuel consumption by light-duty vehicles, stored in a tank
the size of a regulation football field, would require the tank to have
walls nearly 50 miles high. The entire transport sector is not only the
second largest consumer of energy, but it also has recently become the
largest contributor to U.S. greenhouse gas emissions of carbon dioxide,
topping industrial emissions in 1999, primarily due to transport's heavy
reliance on petroleum products, such as motor gasoline.
The nation currently cannot provide for all its
petroleum demand with domestically produced crude oil. The decline in
domestic oil production, coupled with a rise in oil consumption, resulted
in net imports of crude oil and petroleum products surpassing 11.2 million
barrels per day in 2003, with imports reaching an all-time high of just
over 12.2 million barrels per day, of which over 40 percent had originated
at countries belonging to the Organization of Petroleum Exporting
Countries (OPEC). Furthermore, motor gasoline accounted for nearly
one-half (8.9 million barrels per day) of the 20 million barrels per day
of petroleum products consumed domestically in 2003, with 13.2 million
barrels per day of that total identified as transport sector use.

For consumers, energy costs are a foremost concern.
Transportation costs have increased due to many factors related to travel
and prices paid for transportation fuel, while being somewhat offset by
improved fuel economy. In 2001, consumers paid nearly equal amounts for
energy used for household services (ranging from cooking and water heating
to refrigeration and lighting) and for personal transport. The average
household spent $1,520 for transport and remitted $1,493 for household
services, just $27 more per year, as measured in nominal dollars.
By contrast, an average household paid $1,174 for
passenger travel in 1994, while having paid $1,620 for household services
in 1993 - a year in which heating and cooling seasons were well within
30-year norms. It can be argued that, based on those statistics, what
America drives on its roadways has become as important energy-wise as what
heating equipment it places in its basements and appliances in its
electrical sockets.
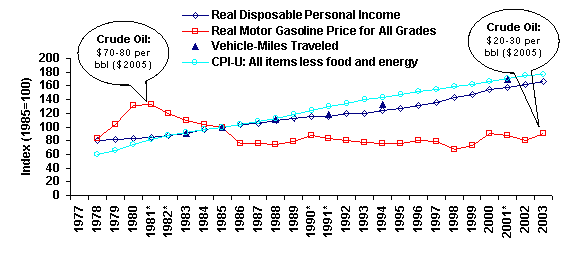
Figure ES2. Annual Indices of Real
Disposable Income, Vehicle-Miles Traveled, Consumer Price Index (CPI-U),
and Real Average Retail Gasoline Price, 1978-2003, 1985=100

Sources: Energy Information Administration, Annual
Energy Review 2003; Bureau of Economic Analysis
Note: * = Recession year.
While the real retail price of gasoline has risen and fallen over
the past two decades, there has been an overall decline of 1.3
percent per year between 1983 and 2001, with substantial drops in
1986 and 1998 and somewhat smaller ones in 1991 and 2001 (see Figure
E1 for a Chronology of World Oil Prices, as this price explains most
of the variations found in refined gasoline prices). In contrast,
the prices of other consumer products have risen dramatically,
taking a higher real percentage of consumers' budgets. Given the
minor role fuel prices have played in determining vehicle use, there
is little surprise that vehicle-miles traveled is better correlated
with disposable income than retail prices; furthermore, the
improvement in energy intensity, though unexceptional, might have
further weakened a diminished price signal by mitigating the effect
of fuel prices, where consumers could travel further on a single
dollar of transportation fuel. Given that retail price is primarily
based on the price paid for crude oil, price signals to consumers
should mimic world crude oil prices, which have exceeded $50 per
barrel (bbl) - at times surpassing $60 per bbl.

Based on expected future energy prices which
partially reflect producers' acquisition costs, the gap between
transport cost and household services cost may expand. Between 2001
and 2006, expenditures for motor gasoline are expected to increase
52 percent in nominal terms (or 36 percent in real terms), up nearly
$800 per household, to an expected $2,923 per household in 2006.

In 2001 there were 107.4 million households in
the United States, of which nearly 98.9 million (92 percent)
actually owned or possessed one or more vehicles, an increase of 1.8
percent per year from 1983, when 86 percent, or 72.2 million out of
84.4 million households, had possessed one or more vehicles. The
increasing number of households and a greater fraction of those
possessing a vehicle, all else been equal, should result in
increased energy needs for the nation.
Since 1983, with some minor deviations, the
growth in vehicle-miles traveled has mirrored the increases in real
disposable income. For instance, between 1983 and 1985, when annual
real gasoline prices dropped 4.4 percent per year, the annual growth
of vehicle-miles traveled (i.e., overall travel) and disposable
income rose 5.4 and 5.5 percent, respectively. Despite some
inconsistencies when travel activity grew faster than disposable
income, their overall growth between 1983 and 2001 is in near
lock-step formation, with real disposable income registering a rise
of 3.2 percent per year and travel activity growing at an annual
rate of 3.6 percent.

Even though sports-utility vehicles (SUVs) are
increasingly popular among Americans, passenger cars still rank as
their overall vehicle of choice, as they make up the majority of
vehicles on America's roadways. Cars, including station wagons,
represented just over 50 percent of the new vehicle purchases in
2001, as reported by the EPA, though in each of the subsequent years
they have lost market share to SUVs. As of 2001, a recession year,
the distribution of sales and scrappage rates had resulted in a
household vehicle fleet of 191.0 million vehicles: 112.4 million (58
percent) passenger cars, 18.4 million (10 percent) vans, 23.2
million (12 percent) SUVs, 35.6 million (19 percent) pickups, and
1.4 million (1 percent) recreational vehicles.

Tracking an economy's energy intensity - one
measure of energy performance - as the ratio of energy per Gross
Domestic Product (GDP) or the environmentally analogous intensity of
carbon dioxide emitted per GDP is common in energy economics, and
such a technique can be applied to transport. Instead of a ratio of
economy-wide energy use per GDP, a ratio of gasoline-equivalent
gallons (GEG) per vehicle-miles traveled for the entire vehicle
stock is calculated. That overall intensity of energy use has
steadily improved since 1983, though the greatest strides in
lowering (improving) energy intensity had occurred before 1991.
Post-1991 intensity improvements (i.e., energy performance) slowed
dramatically, yielding an overall annual improvement of 1.6 percent
between 1983 and 2001, as compared to the 3.2 and 4.2 percent gains
seen in the 1983-1985 and 1985-1988 time periods, respectively. As
evidence of the lopsided improvement in the nation's energy
performance, this report also decomposes the change in energy use
over time.
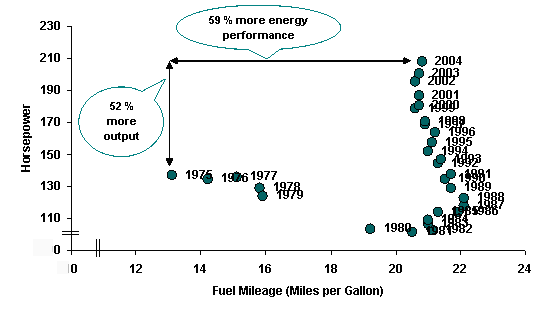
Figure ES3. Sales-Weighted Horsepower
and On-Road Fuel Mileage for New Light-Duty Vehicles, 1975-2004
Model Years

|
Source: Environmental Protection Agency, Fuel Economy Trends
2004 Figure
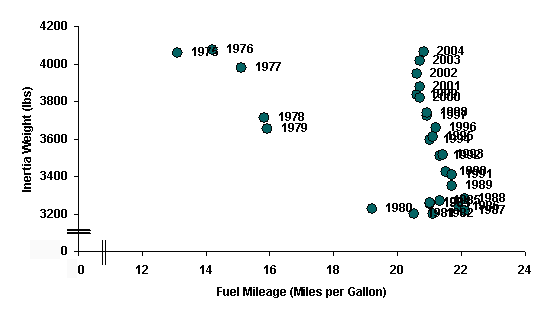
ES4. Sales-Weighted Inertia Weight and On-Road Fuel Mileage
for New Light-Duty Vehicles, 1975-2004 Model Years. |

|
Source: Environmental Protection Agency, Fuel Economy Trends
2004 DECOMPOSING ENERGY USE

Figure ES5. Actual Annual
Energy Growth - All Effects Are Included |
 
|
Source: Calculated by Energy Information
Administration. Consumers'
energy needs for travel using personally owned vehicles (POV)
grew unevenly between 1988 and 2001, averaging 2.46 percent
per year. Measuring…
Figure ES6. Fuel Economy
Effects on Annual Energy Growth
 
|
Source:
Calculated by Energy Information Administration.
the effect on the change in energy use from improving
technologies shows that Fuel Economy effects had
dampened energy use, but those effects have sharply
diminished over time, suggesting significant savings
occurred prior to 1991 and much less so in following
years. By excluding the effects of technology
advancements affecting fuel economy…
Figure ES7. Adjusted
Annual Energy Growth - No Fuel Economy Effects
 
|
Source: Calculated by Energy Information
Administration.
energy use would have surged to even higher
levels, climbing higher than the actual amounts
because of those exclusions - 2.30 percent per
year versus 0.16 percent between 1988 and 1991;
4.35 percent versus 3.03 percent between 1991 and
1994; 4.03 percent versus 3.22 percent between
1994 and 2001, resulting in billions of gallons of
energy "savings" and decreasing, though at a
declining rate, the nation's exposure to oil.
In addition to Fuel Economy
Effects, there are numerous other factors
affecting the change in energy use - though not
always as an offset. Decomposition is a means of
analyzing an overall change over time. The key is
identifying intermediate predictors that are
measurable and dimensionally intertwined with each
other in measurable ratios such that an overall
ratio can be "decomposed" into the product of two
or more "effects," effectively linking them
together. One then can conclude that the
components represent the contributions of the
change in each of the effects represented by the
component ratios to the overall change. |
|
|
|
|


