Platts Top 250 Global Energy Company Rankings
Revenues and profits for many firms surged last year over previous years. The turnaround from our last global survey is dramatic.
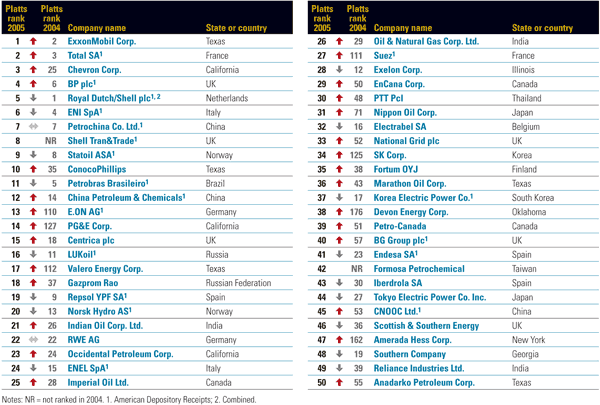
Asset- and revenue-rich integrated oil and gas companies (IOGs) dominate the top rungs of the 2005 Platts Top 250 Global Energy Company Rankings. There are only 31 IOGs in the 250-company ranking, but when you look at the table that starts on the next page, you'll notice that this segment monopolizes the top 12 spots.
A quick financial profile tells the tale: IOGs claim average individual company assets of just over $53-bil, average annual revenues of nearly $62.3-bil, and profits of $5.3-bil. Total combined IOG annual revenue was just over $1.9 trillion. Our top-rated company, ExxonMobil Corp., reported assets of $193-bil, revenues of $264-bil, and profits of $25.3-bil.
No other energy industry segment can match those numbers. Even the strong financial profile of the electric utility (EU) segment seems weak by comparison. Of the 63 EUs on the Top 250 list, average company assets total $20-bil, average revenues came in at $10-bil, and profits at $698-mil. Total combined EU annual revenue was $635.5-bil. It is a testimony to the surging strength of IOGs that the girth of their average annual profits make that $698-mil look, well, thin.
Here's a summary of the total combined annual revenue for the other sectors we surveyed: refining and marketing (26): just over $453-bil; diversified utilities (36 companies): $351-bil; independent power producers (20): $104-bil; exploration and production (30): $145-bil; commodity storage and transfer (17): $85-bil; gas utilities (21): $74.7-bil; coal and consumable fuels (6): just over $11.5-bil.
Take note: Our rankings are based on 2004 financial data. Crude oil and natural gas prices exploded in 2005, allowing most IOGs to post record quarterly earnings. Next year, when our rankings are based on 2005 data, the gap between IOGs and the rest of the industry could well widen.
Revenues and profits have soared
When we last conducted the Platts Top 250 Global Energy Company Ranking, we had a quite different story to tell. A comparison of the two years' results reveals the financial windfall that the energy industry has enjoyed over the past several years. For example, this year we report total combined IOG annual revenue at $1.9 trillion and average profits of $5.3-bil.
Our last report—which included 30 rather than this year's 31 IOG companies—reported total combined revenue of $995-bil and average profits of slightly over $2-bil. To put today's numbers in perspective, annual IOG revenue has nearly doubled, and profits have soared 165%. IOG return on invested capital (ROIC) in our latest table is 16% (our leader, ExxonMobil, posted 22.9%), up from the 10.4% we reported in our last listing.
Top 50: Who's up, who's down

Source: Platts
Note that the huge surge we are reporting in IOG financials in our current ranking was posted with NYMEX light sweet crude oil ending 2004 trading just near $45/bbl (after starting the year at $32.50/bbl). By mid-October NYMEX light sweet crude was trading near $63/bbl, after peaking at $70.85 on August 29.
The ROIC of nearly every segment we ranked this year improved sharply over our last ranking. In addition to the numbers associated with IOGs, in our rankings this year diversified utilities (DUs) posted an ROIC of 7.7%, up from 1.3% in our last ranking. Exploration and production (E&P) companies recorded an ROIC of 12.8%, up from 8.3%; EU—5.3%, up from 4.8%; gas utilities (GUs)—8%, up from 7.5%, and refining and marketing (R&M)—12%, up from 7.1%.
The three segments new to this year's rankings—coal and consumable fuel (C&CF), storage and transfer (S&T), and independent power producers (IPPs)—posted ROICs of 12.8%, 9.5%, and –132%, respectively.
What's that in the road ahead?
There appear to be significant new higher levels of spending by companies searching for and producing crude oil and natural gas. Lehman Brothers' widely respected oil company spending survey—the Original E&P Spending Survey—suggests that worldwide exploration and production expenditures will jump 13.5% in 2005 to $192-bil, compared with the 5.7% increase posted by the companies queried for the 2004 survey.
Lehman found that the 2005 spending plans played no favorites where geography is concerned. The expenditures—by 356 US, Canadian, European, Asian, and Latin American independents, majors, super-majors, and state-owned or national oil companies—are being made wherever oil is thought to reside.
In the US, Lehman carved out the 2005 spending plans of 265 companies with a largely domestic focus. The survey found plans to boost US E&P spending by 16.9%, up from a year-end 2004 estimate of a 7.8% increase.
Copyright © 2005 - Platts
Please visit: www.platts.com
Their coverage of energy matters is extensive!!.