Figure data
Annual Energy Outlook 2005
Market Trends - Electricity Demand and Supply
Continued Growth in Electricity Use Is Expected in All Sectors
 Figure data |
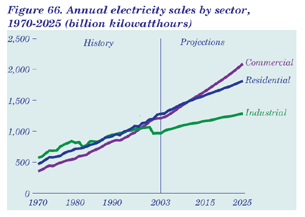
Total electricity sales are projected to increase at an average annual rate of 1.9 percent in the AEO2005 reference case, from 3,481 billion kilowatthours in 2003 to 5,220 billion kilowatthours in 2025 (Figure 66). From 2003 to 2025, annual growth in electricity sales is projected to average 1.6 percent in the residential sector, 2.5 percent in the commercial sector, and 1.3 percent in the industrial sector.
The average size of homes is projected to be larger in 2025 than in 2003 in terms of both square footage and ceiling height, with corresponding increases in electricity use for heating, cooling, and lighting. In addition, expected population shifts to warmer climates increase the amount of electricity used for air conditioning, although the projected increases are mitigated in part by the implementation of a more stringent efficiency standard for air conditioners and heat pumps in 2006.
Projected efficiency gains for electric equipment in the commercial sector are offset by the continuing penetration of new telecommunications technologies and medical imaging equipment, increased use of office equipment, and more rapid additions of floorspace.
Although electricity use is projected to increase with the growth of industrial output, increases in electricity sales to the industrial sector are expected to be offset by a 2.7-percent average annual increase in onsite generation.
Early Capacity Additions Use Natural Gas, Coal Plants Are Added Later
With growing electricity demand and the retirement of 43 gigawatts of inefficient, older generating capacity, 281 gigawatts of new capacity (including end-use combined heat and power) will be needed by 2025. Most retirements are expected to be older oil- and natural-gas-fired steam capacity, along with smaller amounts of older oil- and natural-gas-fired combustion turbines and coal-fired capacity, which are not competitive with newer natural gas combustion turbine or combined-cycle capacity.
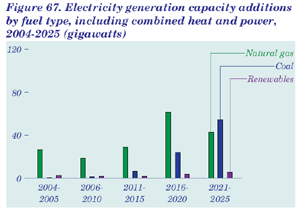 Figure data |
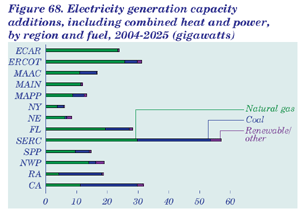 Figure data |
More than 60 percent of new capacity additions are projected to be natural-gas-fired combined-cycle, combustion turbine, or distributed generation technologies (Figure 67). More than 80 percent of the capacity additions will be needed after 2010, when the current excess of generation capacity has been reduced. As natural gas prices rise later in the forecast, new coal-fired capacity is projected to become increasingly competitive, accounting for nearly one-third of the capacity expansion expected in the reference case. Most of the new coal capacity is expected to use advanced pulverized coal technology and to begin operation after 2015. About 16 gigawatts of capacity using advanced clean coal technology, with higher capital costs but relatively low fuel costs, is also expected to be added.
About 5 percent of the projected capacity expansion consists of renewable generating units. Another 7 gigawatts of distributed generation, mostly gas-fired microturbines, is also expected to be added by 2025. Oil-fired steam plants with higher fuel costs and lower efficiencies are expected to be used only for new industrial combined heat and power capacity.
Capacity Additions Are Expected To Be Required in All Regions
Most areas of the United States currently have excess generation capacity, but all the electricity demand regions (see Appendix G for definitions) are expected to need additional, currently unplanned, capacity by 2025 (Figure 68). Some new plants already are under construction, nearly all of which are expected to be completed by 2010.
The need for new capacity is expected to be greatest in the Southeast and the West. Although comparatively small geographically, the Southeast accounts for about 30 percent of projected total demand in 2025 and a comparable share of expected capacity additions. The size of the regionís electricity market is the principal reason for the amount of new capacity required, and the projected growth in its demand for electricity growth is also slightly higher than the national average. The West, which geographically is the largest electricity demand region, currently represents less than 20 percent of the Nationís total electricity demand, but it accounts for 25 percent of projected capacity additions. Relatively strong growth in demand is projected for the West.
Capacity additions in the Southeast and the West are expected to be considerably more diverse than in the other areas of the country, where most additions are projected to be natural-gas-fired capacity. Almost all additions of coal-fired and renewable capacity are expected to be in these two areas. Of the 87 gigawatts of new coal-fired capacity, the Southeast and West account for 36 percent and 40 percent, respectively. Nationally, new renewable generating capacity is expected to total 15 gigawatts, with 28 percent and 34 percent located in the Southeast and West.
Natural Gas and Coal Meet Most Needs for New Electricity Supply
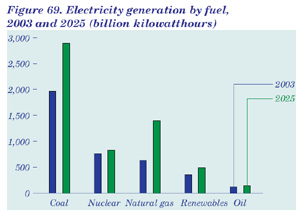 Figure data |
Coal-fired power plants are expected to continue supplying most of the Nationís electricity through 2025 (Figure 69). In 2003, coal-fired plants (including utilities, independent power producers, and end-use combined heat and power) accounted for 51 percent (1,970 billion kilowatthours) of all electricity generation. Their output is projected to increase to 2,890 billion kilowatthours in 2025, while their share of total generation declines to 50 percent as a result of a rapid increase in natural-gas-fired generation.
In compliance with environmental regulations, about one-third of existing coal-fired capacity has been fitted with scrubbers to reduce sulfur dioxide emissions, and another 27 gigawatts of currently existing capacity is expected to have scrubbers in 2025. A total of 87 gigawatts of new coal-fired capacity is projected to be added in the reference case, mostly after 2010, as natural gas prices continue to rise. Nuclear generation, currently the second-largest source of electricity, is expected to increase modestly, as a result of additional improvements in plant performance and expansions of existing capacity, before leveling off after 2017.
Natural gas is expected to have the largest increase in its share of total electricity generation, from 17 percent in 2003 to 20 percent in 2010 and 24 percent in 2025, and by 2010 it is expected to overtake nuclear power as the second-largest source of electricity production. Generation from renewable sources, including hydropower, is projected to increase by 36 percent from 2003 to 2025, but its share of total electricity supply is projected to decline from 9 percent in 2003 to 8 percent in 2025.
Nuclear Power Plant Capacity Factors Are Expected To Increase Modestly
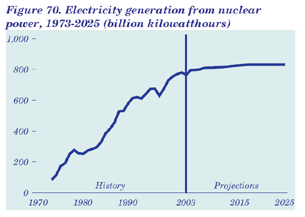 Figure data |
The United States currently has 104 commercial nuclear reactors licensed to operate, providing about 20 percent of the total 3,690 billion kilowatthours of electricity generated in 2003 (Figure 70). The performance of U.S. nuclear units has improved recently; the national average capacity factor rose to 90 percent in 2002 before dropping slightly to 88 percent in 2003. It is assumed that performance improvements will continue even as the plants age, leading to a weighted average capacity factor of 92 percent after 2010.
In the reference case, no nuclear units are projected to be retired from 2003 to 2025. Nuclear capacity grows slightly, due to assumed increases at existing units. The U.S. Nuclear Regulatory Commission (NRC) approved 8 applications for power uprates in 2003, and another 12 were approved or pending in 2004. The reference case assumes that all the uprates will be carried out, as well as others expected by the NRC over the next 15 years, leading to an increase of 3.5 gigawatts in total nuclear capacity by 2025. No new nuclear units are expected to become operable between 2003 and 2025.
Nuclear units would be retired if their operation were no longer economical relative to the cost of building replacement capacity. By 2025, the majority of nuclear units will be beyond their original license expiration dates. As of December 2004, license renewals for 30 nuclear units had been approved by the NRC, and 16 other applications were being reviewed. As many as 28 additional applicants have announced intentions to pursue license renewals over the next 3 years, indicating a strong interest in maintaining the existing stock of nuclear plants.
Least Expensive Technology Options Are Likely Choices for New Capacity
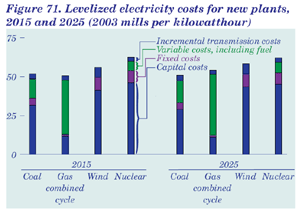 Figure data |
|||||||||||||||||||||||||||||||||||||||||||||||
| Table 27. Costs of producing electricity from new
plants, 2015 and 2025 Printer friendly version
|
|||||||||||||||||||||||||||||||||||||||||||||||
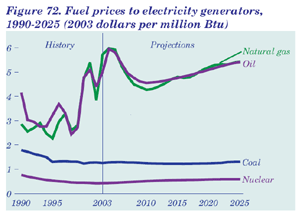 Figure data |
|||||||||||||||||||||||||||||||||||||||||||||||
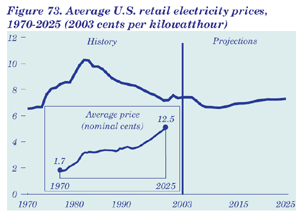 Figure data |
|||||||||||||||||||||||||||||||||||||||||||||||
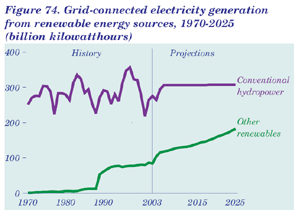 Figure data |
|||||||||||||||||||||||||||||||||||||||||||||||
Technology choices for new generating capacity are made to minimize cost while meeting local and Federal emissions constraints. The choice of technology for capacity additions is based on the least expensive option available (Figure 71) [136]. The reference case assumes a capital recovery period of 20 years. In addition, the cost of capital is based on competitive market rates, to account for the risks of siting new units.
Capital costs are expected to be reduced over time (Table 27), at rates that depend on the current stage of development for each technology. For the newest technologies, capital costs are initially adjusted upward to reflect the optimism inherent in early estimates of project costs. As project developers gain experience, the costs are assumed to decline. The decline continues at a progressively slower rate as more units are built. The performance (efficiency) of new plants is also assumed to improve, with heat rates for advanced combined cycle and coal gasification units declining to 6,333 and 7,200 Btu per kilowatthour, respectively, by 2010.
Coal and Nuclear Fuel Costs Are Expected To Be Stable
Electricity production costs are a function of the costs for fuel, operations and maintenance, and capital. Fuel costs make up most of the operating costs for fossil-fired units. For a new coal-fired plant built today, fuel costs would represent about one-half of total operating costs, whereas the share for a new natural-gas-fired plant would be almost 90 percent. For nuclear units, fuel costs typically are a much smaller portion of total production costs, and nonfuel operations and maintenance costs make up a much larger share.
The impact of higher natural gas prices in the projections is offset by increased generation from coal-fired and nuclear power plants and by higher generation efficiencies as new capacity is installed. Although natural gas prices have been volatile in recent years, delivered prices to electricity generators are projected to peak at $6 per million Btu in 2004, then drop by almost 30 percent by 2010 before climbing steadily to almost $5.50 per million Btu in 2025 (Figure 72). Nuclear fuel costs, currently around $0.40 per million Btu (roughly 4 mills per kilowatthour), are projected to rise to about $0.60 per million Btu in 2025. Delivered petroleum prices to electricity generators follow a price path similar to that for natural gas prices, with a sharp drop through 2010 followed by a steady rise through 2025. Despite increasing fuel costs, the natural gas share of total generation is projected to increase from 16 percent in 2003 to 24 percent in 2025 because of the higher efficiency of gas-fired capacity.
Average Electricity Prices Decline From 2001 Highs, Then Gradually Rise
Average U.S. electricity prices, in real 2003 dollars, are expected to decline by 11 percent, from 7.4 cents per kilowatthour in 2003 to 6.6 cents in 2011 (Figure 73), then rise to 7.3 cents per kilowatthour in 2025. Prices follow the trend of the generation cost component of price, which makes up 65 percent of the total price of electricity and changes mainly in response to changes in natural gas prices. The distribution component, 28 percent of the total electricity price, is expected to decline from 2003 to 2025 at an average annual rate of 0.7 percent, as the cost of distribution infrastructure is spread over a growing amount of total electricity trade. Transmission prices are expected to increase at an average annual rate of 1.0 percent because of the additional investment needed to meet projected growth in electricity demand. Electricity prices for individual customer classes are projected to follow the average price trend, declining through 2011 and then increasing for the remainder of the forecast. Residential and commercial prices in 2025 are projected to be slightly lower than 2003 prices, and industrial prices are expected to be slightly higher than in 2003.
Competition in retail and wholesale generation markets can strongly influence electricity prices. In 2004, 17 States and the District of Columbia had competitive retail electricity markets in operation. Montana, Nevada, New Mexico, and Oklahoma have delayed opening competitive retail markets; Arkansas has repealed its restructuring legislation; and Californiaís competitive retail market is suspended. Many States have cited a lack of operational wholesale markets and inadequate generation and transmission capacity as reasons for delaying retail competition.
Increases in Nonhydropower Renewable Generation Are Expected
Despite strong growth in renewable electricity generation as a result of technology improvements and expected higher fossil fuel costs, grid-connected generators using renewable fuels (including combined heat and power and other end-use generators) are projected to remain minor contributors to U.S. electricity supply. From 359 billion kilowatthours in 2003 (9.3 percent of total generation) renewable generation increases to only 489 billion kilowatthours (8.5 percent) in 2025 (Figure 74).
Conventional hydropower remains the major source of renewable generation in the AEO2005 reference case. After 4 years of below-normal precipitation, hydroelectric generation is expected to recover in 2005; however, with little new capacity expected, conventional hydropower generation is projected to increase from 275 billion kilowatthours in 2003 (7.1 percent of total generation) to just 307 billion kilowatthours (5.3 percent of the total) in 2025. Other renewables account for 5.3 percent of projected additions to capacity from 2003 to 2025 and 6.4 percent of the projected increase in generation. Generation from nonhydropower renewables increases from 84 billion kilowatthours in 2003 (2.2 percent of generation) to 182 billion kilowatthours in 2025 (3.2 percent). Biomass, including combined heat and power systems and biomass co-firing in coal-fired plants, is the largest source of other renewable generation in the forecast. Electricity from biomass combustion increases from 37 billion kilowatthours in 2003 (1.0 percent) to 81 billion kilowatthours in 2025 (1.4 percent), with 49 percent of the increase coming from dedicated power plants and the rest primarily from combined heat and power.
Biomass, Wind, and Geothermal Lead Growth in Renewables
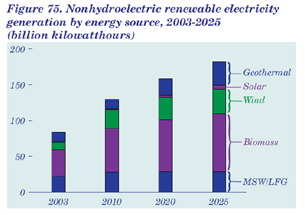 Figure data |
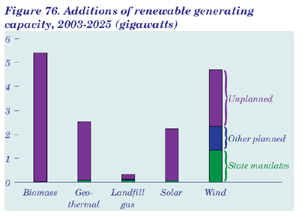 Figure data |
AEO2005 projects significant increases in electricity generation from both geothermal and wind power (Figure 75). In the West, geothermal output increases from 13 billion kilowatthours in 2003 to 33 billion kilowatthours in 2025. Wind-powered generating capacity increases from 6.6 gigawatts in 2003 to 11.3 gigawatts in 2025, and generation from wind capacity increases from less than 11 billion kilowatthours in 2003 to 35 billion in 2025. The mid-term prospects for wind power are uncertain, depending on response to the recent extension of the Federal production tax credit through 2005 and the likelihood of further extensions, as well as responses to State programs, technology improvements, transmission availability, and public interest.
Generation from municipal solid waste and landfill gas (MSW/LFG) is projected to increase by 7 billion kilowatthours, to 29 billion kilowatthours in 2025, but little new municipal solid waste capacity is expected. Solar technologies generally are projected to remain too costly to be competitive in supplying power to the grid. Central-station photovoltaic capacity increases in the forecast from about 40 megawatts in 2003 to 400 megawatts in 2025, and solar thermal capacity increases from about 400 megawatts to more than 500 megawatts. In contrast, individual grid-connected photovoltaic installations grow rapidly, from about 60 megawatts in 2003 to nearly 1,800 megawatts in 2025. Grid-connected photovoltaics and solar thermal, which together provided about 0.7 billion kilowatthours of electricity in 2003, are projected to supply nearly 6 billion kilowatthours in 2025 [137].
State Programs Will Continue To Support Renewable Energy Use
In the AEO2005 reference case, 14.9 gigawatts of new nonhydroelectric renewable energy capacity is projected to enter service from 2003 through 2025, including 10.6 gigawatts in the electric power sector, 2.6 gigawatts of combined heat and power, and 1.7 gigawatts of end-use applications. In the electric power sector, 1.6 gigawatts is projected as a result of State requirements and goals (wind 1.3 gigawatts, geothermal and landfill gas each 0.1 gigawatt, plus smaller amounts of biomass, waste, and solar capacity) and the rest from commercial projects (Figure 76).
Most new renewables capacity projected in the near term results from specific projects and State programs. After 2010, the projected growth in renewable energy capacity is based on its ability to become competitive in electricity markets. The Federal production tax credit for wind plants was not extended until late in 2004, and so only 213 megawatts of new wind capacity is expected to be completed in 2004. In 2005, however, more than 1 gigawatt of new capacity is expected to enter service before the credit expires on December 31.
Because States with renewable energy requirements have not added capacity as rapidly as projected in earlier forecasts, projections for new capacity resulting from State renewable portfolio standards, mandates, and nonmandatory goals are reduced in AEO2005, but they are still significant, including 903 megawatts expected in Texas, 146 megawatts each in California and Minnesota, 141 megawatts in Nevada, 80 megawatts in New Mexico, and 65 megawatts in Pennsylvania.
Renewables Are Expected To Become More Competitive Over Time
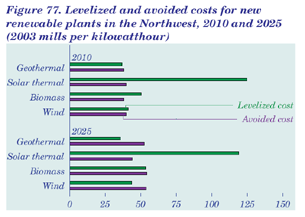 Figure data |
The competitiveness of both conventional and renewable generation resources is based on the most cost-effective mix of capacity that satisfies the demand for electricity across all hours and seasons. Baseload technologies tend to have low operating costs and set the marginal cost of power only during the hours of least demand. Dispatchable geothermal and biomass resources compete directly with new coal and nuclear plants, which to a large extent determine the avoided cost [138] for baseload energy (Figure 77). In some regions and years, new geothermal or biomass plants may be competitive with new coal-fired plants, but their development is limited by the availability of geothermal resources or competitive biomass fuels.
Intermittent technologiesóspecifically, wind and solarócan be used only when resources are available. Because of their relatively low operating costs and limited resource availability, the avoided costs of these technologies are determined largely by the operating costs of the most expensive units operating when their resources are available. Solar generators tend to operate during peak load periods, when gas-fired combustion turbines and combined-cycle units with higher fuel costs tend to determine avoided cost. The levelized cost of solar thermal generation is projected to be significantly higher than its avoided cost through 2025. The availability of wind resources varies among regions, but wind plants generally tend to displace intermediate load generation. Thus, the avoided costs of wind power will be determined largely by the low-to-modest operating costs of combined-cycle and coal-fired plants. In some regions and years, the levelized costs for wind power are projected to be below its avoided costs.
Gas-Fired Technologies Lead New Additions of Generating Capacity
The AEO2005 reference case uses the cost and performance characteristics of generating technologies to select the mix and amounts of new generating capacity for each year in the forecast. Values for technology characteristics are determined in consultation with industry and government specialists, but uncertainty surrounds the assumptions for new technologies. In the high fossil fuel case, capital costs, heat rates, and operating costs for advanced fossil-fired generating technologies (integrated coal gasification combined cycle, advanced combined cycle, and advanced combustion turbine) reflect a 10-percent reduction from reference case levels in 2025. The low fossil fuel case assumes no change in capital costs and heat rates for advanced technologies from their 2005 levels.
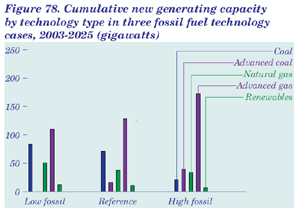 Figure data |
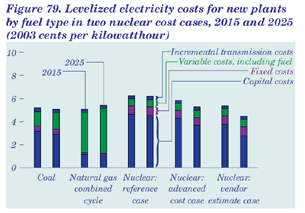 Figure data |
Natural gas technologies make up the largest share of new capacity additions in all cases, but the mix of current and advanced technologies varies (Figure 78). In the high fossil fuel case, advanced technologies are used for 84 percent (173 gigawatts) of projected gas-fired capacity additions, compared with 69 percent (110 gigawatts) in the low fossil fuel case. The coal share of total capacity additions varies from 22 percent to 33 percent in the cases. In the low fossil fuel case, only a negligible amount of advanced coal-fired generating capacity is added. In the high fossil fuel case, advanced coal technologies are more competitive, making up 65 percent of all coal-fired capacity additions. The projections for average fossil fuel efficiency in the electric power sector in 2025 are 37 percent in the reference case, 38 percent in the high fossil fuel case, and 36 percent in the low fossil fuel case, based on different assumptions about the penetration of advanced technologies in the cases.
Sensitivity Cases Look at Possible Reductions in Nuclear Power Costs
The AEO2005 reference case assumptions for the cost and performance characteristics of new technologies are based on cost estimates by government and industry analysts, allowing for uncertainties about new, unproven designs. Two alternative nuclear cost cases analyze the sensitivity of the projections to lower costs for new nuclear power plants. The advanced nuclear cost case assumes capital and operating costs 20 percent below the reference case in 2025, reflecting a 28-percent reduction in overnight capital costs from 2005 to 2025. (Earlier analysis showed that a 10-percent reduction in capital and operating costs would be insufficient to stimulate new nuclear construction.) The vendor estimate case assumes reductions relative to the reference case of 18 percent initially and 38 percent in 2025. These costs are consistent with estimates from British Nuclear Fuels Limited for the manufacture of its advanced pressurized-water reactor (AP1000). Cost and performance characteristics for all other technologies are assumed to be the same as those in the reference case.
Projected nuclear generating costs in the two alternative nuclear cost cases are competitive with the generating costs projected for new coal- and natural-gas-fired units toward the end of the projection period (Figure 79). In the advanced nuclear case 7 gigawatts of new nuclear capacity is added by 2025, and in the vendor estimate case 25 gigawatts is added by 2025. The additional nuclear capacity displaces primarily projected new coal-fired capacity. The projections in Figure 79 are average generating costs, assuming generation at the maximum capacity factor for each technology; the costs and relative competitiveness of the technologies could vary across regions.
Rapid Economic Growth Would Boost New Coal and Renewable Capacity
The projected annual average growth rate for GDP from 2003 to 2025 ranges from 3.6 percent in the high economic growth case to 2.5 percent in the low economic growth case. The difference leads to a 4-percent change in projected electricity demand in 2010 and a 12-percent change in 2025, with a corresponding difference of 105 gigawatts in the amount of new capacity projected to be built from 2003 to 2025 in the high and low economic growth cases, including combined heat and power in the end-use sectors.
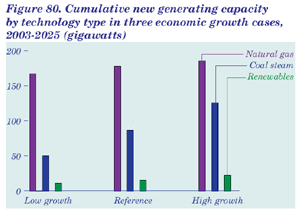 Figure data |
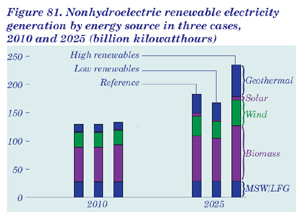 Figure data |
Most (74 percent) of the new capacity projected to be needed in the high economic growth case beyond that added in the reference case is expected to consist of new coal-fired plants. The stronger demand growth assumed in the high growth case is also projected to stimulate additions of renewable plants and new natural-gas-fired capacity (Figure 80). In the low economic growth case, total capacity additions are reduced by 53 gigawatts, and 70 percent of that projected reduction is in coal-fired capacity additions.
Average electricity prices in 2025 are 5 percent higher in the high economic growth case than in the reference case, due to higher natural gas prices and the costs of building additional generating capacity. Electricity prices in 2025 in the low economic growth case are projected to be 4 percent lower than in the reference case. In the high economic growth case, a 5-percent increase in consumption of fossil fuels results in a 6-percent increase in carbon dioxide emissions from electricity generators in 2025.
Lower Cost Assumptions Increase Biomass and Geothermal Capacity
The impacts of key assumptions about the availability and cost of nonhydroelectric renewable energy resources for electricity generation are shown in two alternative technology cases. In the low renewables case, the cost and performance of generators using renewable resources are assumed to remain unchanged throughout the forecast. The high renewables case assumes cost reductions of 10 percent in 2025 on a site-specific basis for hydroelectric, geothermal, biomass, wind, and solar generating capacity (however, no new additions of conventional hydropower are projected in any of the cases, given the lack of suitable new sites for development).
In the low renewables case, construction of new renewable capacity is less than projected in the reference case (Figure 81). In the high renewables case, more additions of biomass, geothermal, and wind capacity are projected through 2025 than in the reference case, with most of the incremental capacity added between 2010 and 2025. In 2025, projected total electricity generation from nonhydropower renewables is 52 billion kilowatthours higher in the high renewables case than in the reference case, with most of the increment coming from geothermal (22.8 billion kilowatthours), biomass (18.0 billion kilowatthours), and wind energy (10.1 billion kilowatthours). Still, nonhydropower renewables are projected to remain relatively small contributors to total generation in the high renewables case, accounting for 134 billion kilowatthours (2.9 percent of the total) in 2010 and 235 billion kilowatthours (4.1 percent) in 2025.