Survey shows OPEC October crude output falls 240,000
b/d
Crude production from OPEC's 11 members fell 240,000 b/d to
30.07-mil b/d in October from 30.31-mil b/d in September, a
Platts survey of OPEC and oil industry officials showed
Wednesday.
The drop largely reflected a plunge in output from Iraq,
whose production and exports have fluctuated widely since the
March 2003 US-led invasion as the country has struggled to
rebuild its beleaguered oil sector.
Excluding Iraq, production from the ten members with
notional quotas under a 28-mil b/d ceiling dipped 50,000 b/d
to 28.27-mil b/d in October from 28.32-mil b/d the previous
month.
Poor weather conditions in the Persian Gulf dealt a blow to
Iraqi crude exports and production in October. But weather was
not the only factor in lower Iraqi volumes, which have been
hit by power outages, limited well maintenance, higher water
levels in oil wells, and pipeline problems. Iraqi production
fell to 1.8-mil b/d in October from 1.99-mil b/d in September.
Saudi Arabian production edged down 60,000 b/d to 9.5-mil
b/d from 9.56-mil b/d in September. Venezuelan output, which
has not recovered from a crippling oil workers' strike in the
winter of 2002-2003, also eased back, by 10,000 b/d, to
2.6-mil b/d.
Small increases of 10,000 b/d came from Algeria, where
foreign companies have helped boost output steadily in recent
years, and Qatar.
Following OPEC's September offer to place its 2-mil b/d of
spare capacity at the disposal of the market, some analysts
had expected OPEC to hold production close to its highest
level in more than 25 years last month.
Most of that spare capacity is held by the group's biggest
producer, Saudi Arabia, which says it can pump as much as
11-mil b/d now and plans to boost capacity to 12.5-mil b/d by
2009.
Prices have fallen by more than ten dollars since late
August when US light crude hit an all-time high of $70.85/bbl.
Updated: November 9, 2005

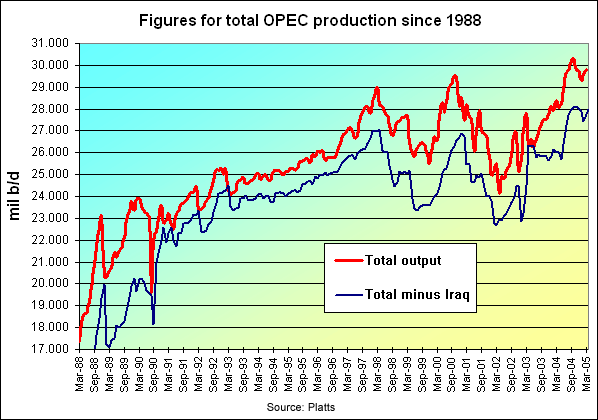
The chart above tracks the development of
OPEC supply of crude oil to the world since
the late 1980s. See also the
current production table for more
detail.
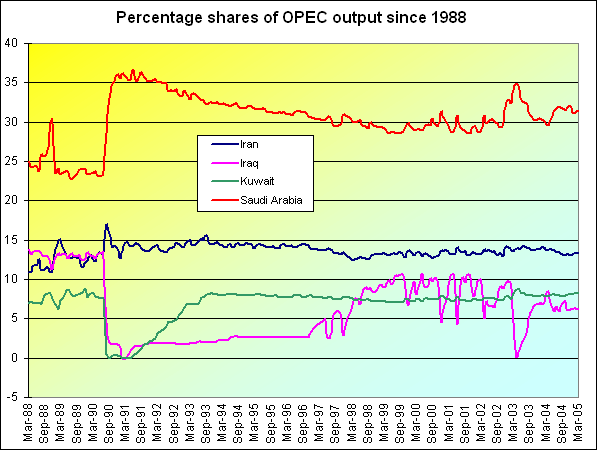
This chart shows the percentage shares of
OPEC output since 1988 for Iran, Iraq,
Kuwait and Saudi Arabia. |
|
|
|

|
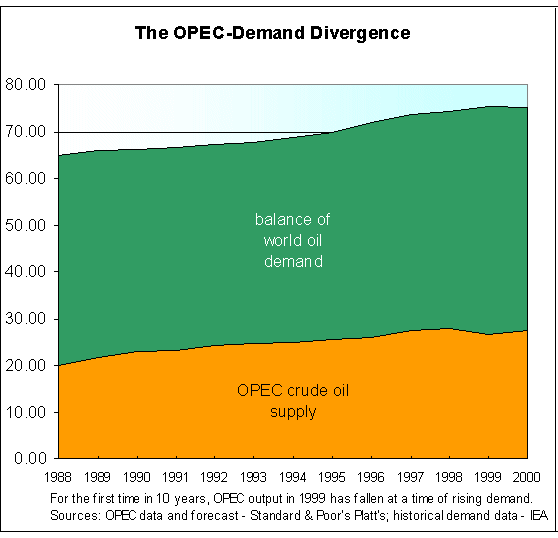
This chart demonstrates how OPEC's share of
world oil production has effectively fallen
since the late 1980s, as world demand as
risen. Figures are in millions of barrels a
day. |
|
|
|

Copyright © 2005 - Platts
Please visit:
www.platts.com
Their coverage of energy matters is extensive!!.
|