Total primary energy consumption in the United States is projected to increase from 98 quadrillion British thermal units (Btu) in 2002 to 137 quadrillion Btu in 2025, an average annual increase of 1.5 percent, according to the Annual Energy Outlook 2004 (AEO2004).
U.S. energy consumption is expected to increase more rapidly than domestic energy supply, and net imports will constitute 36 percent of consumption in 2025, up from 26 percent in 2002.
Economic Growth
In the AEO2004 reference case, U.S. gross domestic product (GDP) grows at an average annual rate of 3.0 percent from 2002 to 2025, slightly lower than the growth rate of 3.1 percent per year for the same period in AEO2003.
Petroleum
The trend of increasing U.S. dependence on imported oil is expected to continue. Net imports, which accounted for 37 percent of total U.S. petroleum demand in 1980 and 53 percent in 2002, are expected to reach 70 percent in 2025.
Petroleum demand is projected to grow at an average annual rate of 1.6 percent, from 20 million barrels per day in 2002 to 28 million barrels per day in 2025, led by the transportation sector, which is expected to account for 74 percent of petroleum demand in 2025.
Crude oil production increases from 5.7 million barrels per day in 2002 to 6.1 million barrels per day in 2008 as a result of higher offshore production. Beginning in 2009, however, U.S. crude oil production declines gradually, falling to 4.6 million barrels per day in 2025.
The average world oil price is forecast to decline from current levels to $23 per barrel in 2005, and then rise slowly to $27 per barrel in 2025 (prices in 2002 dollars).
Natural Gas
AEO2004 forecasts greater dependence on more costly supplies of natural gas, such as imports of liquefied natural gas (LNG), and remote resources from Alaska and the Mackenzie Delta in Canada.
Demand for natural gas is projected to increase at an average annual rate of 1.4 percent between 2002 and 2025, primarily from growth in demand for electricity generation and industrial applications. Growth slows after 2020 as rising prices for natural gas make it less competitive for electricity generation.
Average wellhead prices for natural gas are projected to increase from $2.95 per thousand cubic feet (2002 dollars) in 2002 to $3.40 in 2010. With the exception of a temporary decline in prices just before 2020, when an Alaska pipeline is expected to be completed, wellhead prices are projected to increase gradually after 2010, reaching $4.40 per thousand cubic feet in 2025.
LNG imports, Alaskan production, and production in the 48 States from nonconventional sources are not expected to increase enough to offset the impacts of resource depletion and increased demand.
Coal
In AEO2004, total coal use is projected to grow by 1.7 percent per year, compared with the AEO2003 projection of 1.4 percent per year. The primary reason for the change in the rate of growth is a substantial increase in projected coal demand for electricity generation resulting from higher natural gas prices. Coal is projected to play a more important role in future additions to electricity generation capacity, particularly in the later years of the forecast.
Production from mines west of the Mississippi River is expected to provide the largest share of the incremental production. In 2025, nearly two-thirds of coal production is projected to originate from the western States.
The average minemouth price of coal is projected to decline from $17.90 (2002 dollars) in 2002 to a low of $16.19 per short ton in 2016. Prices decline because of increased mine productivity, a shift to western production, declines in rail transportation costs, and competitive pressures on labor costs.
After 2016, however, average minemouth coal prices rise as productivity improvements slow and the industry faces increasing costs to open new mining areas. In 2025, the average minemouth price is projected to be $16.57 per short ton, still lower than the real price in 2002.
Electricity
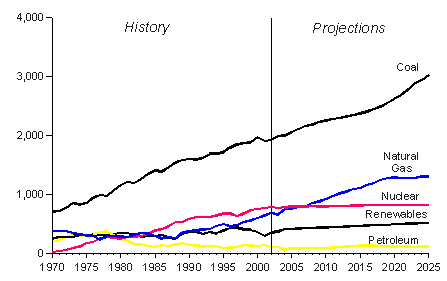
Total electricity consumption, including purchases from electric power producers and on-site generation, is projected to grow at an average rate of 1.8 percent per year, reaching 5,485 billion kilowatthours in 2025.
| Electricity Generation by Fuel, 1970-2025 (Billion Kilowatthours) |
|
 |
|
|
Source: Energy Information Administration. |
Growth in electricity use for computers, office equipment, and electrical appliances in the residential and commercial sectors is partially offset by improved efficiency in these and other, more traditional electrical applications, by the effects of demand-side management programs, and by slower growth in electricity demand for some applications, such as air conditioning.
Average delivered electricity prices are projected to decline from 7.2 cents per kilowatthour in 2002 to a low of 6.6 cents (2002 dollars) in 2007 as a result of cost reductions in an increasingly competitive market -- where excess capacity has resulted from the recent boom in construction -- and continued declines in coal prices.
After 2007, average real electricity prices are projected to increase, reaching 6.9 cents per kilowatthour in 2025 (13.2 cents in nominal dollars).
The natural gas share of electricity net generation is projected to increase from 18 percent in 2002 to 22 percent in 2025, while the share from coal will rise from 50 percent in 2002 to 52 percent in 2025.
Total renewable electricity net generation is projected to increase from 347 billion kilowatthours in 2002 to 518 billion kilowatthours in 2025, at an average annual growth rate of 1.9 percent.
Nuclear Energy
Nuclear generating capacity is projected to increase from 99 gigawatts in 2002 to 103 gigawatts in 2025. In a departure from AEO2003, no U.S. nuclear units are retired in the AEO2004 reference case.
AEO2004 assumes that Browns Ferry Unit 1 will begin operation in 2007 but projects that no new nuclear facilities will be built before 2025.
Renewable Energy
Total renewable fuel consumption, including ethanol for gasoline blending, is projected to grow at an average rate of 1.9 percent per year, from 6 quadrillion Btu in 2002 to 9 quadrillion Btu in 2025, primarily as a result of State mandates for renewable electricity generation.
About 60 percent of the projected demand in 2025 is for grid-related electricity generation, and the rest is for dispersed heating and cooling, industrial uses, and fuel blending. Growth in renewable energy production is forecast for biomass, ethanol for gasoline blending, conventional hydroelectric, geothermal, and wind sources.
| Projected U.S. Carbon Dioxide Emissions
by Sector and by Fuel, 1990-2025 (Million Metric Tons) |
|
 |
|
|
Source: Energy Information Administration. |
Energy Intensity
Energy intensity -- defined as energy use per dollar of gross domestic product -- is projected to decline at an average annual rate of 1.5 percent in the AEO2004 forecast, with efficiency gains and structural shifts in the economy offsetting growth in demand for energy services.
Carbon Dioxide Emissions
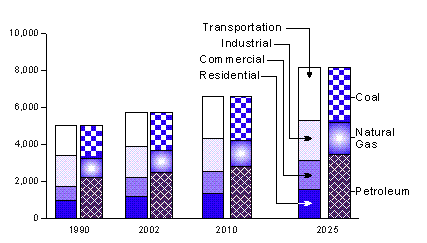
Carbon dioxide emissions from energy use are projected to increase from 5,729 million metric tons in 2002 to 8,142 million metric tons in 2025 in AEO2004, an average annual increase of 1.5 percent.
By sector, projected carbon dioxide emissions from residential, commercial, and electric power sector sources are higher in AEO2004 than they were in AEO2003 because of an updated estimate of 2002 emissions and higher projected energy consumption in each of the three sectors -- particularly, coal consumption in the electric power sector.
Projected carbon dioxide emissions from the industrial and transportation sectors are lower in the AEO2004 forecast, because of lower projections for industrial natural gas consumption and the new corporate average fuel economy (CAFE) standards for light trucks as well as other changes in the transportation sector that lead to lower petroleum consumption.
Annual Energy Outlook 2004,
DOE/EIA-0383(2004); 270 pages, 33 tables, 120 figures.
To order a hard copy of the report:
Contact the U.S. Government Printing Office (GPO) at 866-512-1800 (Toll Free) or 202-512-1800 (DC Area), and request Energy Information Administration publication GPO Stock No. 061-003-01136-5, published January, 2004.
The price per copy is $46.00 ($64.40 non-U.S. addresses) which includes regular domestic postage and handling and is subject to change.
Allow a minimum of 6 weeks for domestic delivery and an additional 6 weeks for international delivery.
This publication is available in a variety of electronic formats on the EIA Web site at http://www.eia.doe.gov/oiaf/aeo/.