GREENLAND ICE SHEET FLOWS FASTER DURING SUMMER MELTING
 |
 |
| |
|
Image 1 |
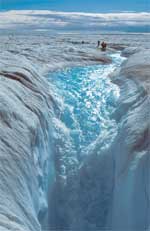
Meltwater
stream flowing into a large moulin in the ablation zone (area
below the equilibrium line) of the Greenland ice sheet. Photo
Courtesy: Roger J. Braithwaite, The University of Manchester, UK
|
New
measurements show that the flow of ice in the Greenland ice sheet
has been accelerating since 1996 during the summer melt season. The
results suggest that the ice sheet may be responding more quickly to
the warming climate than previously thought.
In an
article published in Science magazine's online Sciencexpress June 7,
Jay Zwally, an ICESat Project scientist at the NASA Goddard Space
Flight Center, Greenbelt, Md., Waleed Abdalati, Polar Program
scientist at NASA Headquarters, Washington, and colleagues report
that increases in ice velocity during the summer are correlated with
the timing and the intensity of ice sheet surface melting.
Using
periodic Global Positioning Satellite measurements from 1996 through
1999, the researchers discovered that the ice flow speeds up from
31.3 cm (12.3 inches) per day in winter to a peak of 40 cm (15.7
inches) per day in the summer when surface melting is largest. "This
study demonstrates that surface meltwater travels quickly through
the 1200 meter (approx. 3/4 mile) thick ice to the bedrock to make
the ice slide faster. This process was known for decades to enhance
the flow of small mountain glaciers, but was not known to occur in
the large ice sheets," Zwally said.
 |
 |
| |
|
Image 2 |
This
schematic highlights glaciological features of the ice sheet
including surface lakes, crevasses, and large openings called
moulins, that stretch up to 10 meters in diameter and drain to
the bedrock. Meltwater descends through the moulins, down to the
bedrock, contributing to the movement of the ice sheet. The
Equilibrium Line (EQ LINE), similar to a snow line on the
glacier, is at about 1200 meters elevation in west-central
Greenland. In the ablation zone below the EQ LINE, all the
winter snow plus some of the ice flowing from higher elevations
melts each summer. "GPS" is the marker where the "Global
PositioningSystem" was located to observe the movement of the
ice sheet. The "V" indicates the velocity of the movement of the
ice, some of which is from sliding over the bedrock.
|
The
meltwater makes its way from the surface to the bedrock by draining
into crevasses and large tunnels called moulins that may be as large
as 10 meters (approx. 33 feet) in diameter. More meltwater
underneath the ice sheet provides lubrication to allow the ice sheet
to move faster toward the coastline of Greenland.
Over
time, as ice melts from the top of the ice sheet, the ice thins and
spreads out toward lower elevations closer to the coast. The
meltwater also carries heat (in the form of water) from the top of
the ice to the base of the ice that sits on the bedrock.
 |
 |
| |
|
Image 3 |
|
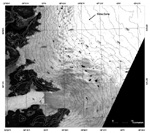
These are elevation contours (50 m or 164 feet)
overlain on a Landsat image taken on June 22, 1990,
which is typically about 1/3 of the way through the
melt season.
The greyer areas at lower elevations in the image
are bare ice, with some whiter patches of remaining
winter snow near the ice-snow line. By the end of
the melt season in late August to early September
the firn-ice (Firn is snow that is more than one
year old) boundary usually retreats to around the
average location of the equilibrium line near the
Swiss Camp. The dark patches are melt lakes, some of
which show dark lines of inflow channels. Later in
the season, melt lakes also form above the
equilibrium line. |
|
|
|
A
separate study by Abdalati and Konrad Steffen of the University of
Colorado showed that the melting of the ice sheet surface has been
increasing at a rate of nearly 20% over the last 21 years, while
summer temperatures in that same period have increased by one
quarter of a degree Celsius (.45º Fahrenheit). The link between ice
sheet melt and ice flow suggest that the increasing melt may be more
significant than previously believed.
The
faster ice flow, ice thinning and consequent lowering of the surface
elevation of the ice sheet can open a feedback to more melting that
has not been considered in computer models that predict ice sheet
response to climate change.
NASA's
ICESat mission, which is planned for launch in December of this
year, will use a laser altimeter to monitor ice sheet elevations and
show elevation changes as small as 1 cm/yr. ICESat's measurements
will tell us whether the ice sheets are growing or shrinking
overall, how much they are contributing to sea level change, and
will help predict future changes in ice volume and sea level.
Zwally
and his colleagues speculate that increased movement of the ice
sheet due to more meltwater underneath the ice sheet may have
contributed to the demise of the Laurentide ice sheet approximately
10,000 years ago. During that time, the Earth's axis of rotation was
more tilted toward the Sun causing warmer summers in the Northern
Hemisphere.
Further, they suggest that the observed process may also have
contributed to the extensive melting of the Greenland Ice Sheet
during the last Interglacial period, some 125,000 years ago.
According to the U.S. Geological Survey, previous studies have shown
that during the last Interglacial period, carbon dioxide (CO2)
concentrations in the atmosphere were relatively high, temperatures
may have been higher than the present, and sea level may have been
approximately 6 meters (19.5 feet) higher.
"During
this time when the climate was warmer, the ice sheet was less
extensive. With the predicted greenhouse warming we may be returning
to similar conditions," Zwally said.
This research was funded under NASA's ICESat Project.
Page lifted from:
http://www.gsfc.nasa.gov/topstory/20020606greenland.html
|