| If household electronic devices
used high-efficiency power supplies, residential electricity usage
would be 47 billion kWh per year less than business-as-usual,
saving consumers more than $4 billion per year. The electrical
output from the equivalent of 7,000 MW of baseload generating
capacity and more than 0.5% of total U.S. CO2 emissions would be
eliminated. The incremental costs to consumers would be repaid in
an average of a year or so, often much less. The technology to
reap these efficiencies is already in use in many electronic
devices. Inertia at the manufacturer and retailer level and the
usual benefit-cost myopia at the consumer level are the
long-standing obstacles to rapid market penetration.
This two-part article discusses in detail a simple, obvious,
and consumer-friendly way for the government to make these savings
a reality. The question is whether the political will exists to
mandate a level of efficiency that will likely never arise
voluntarily. Part I of this article discusses power supplies and
power supply efficiency, total loads and avoidable losses,
potential savings, and potential criticism of these analyses. Part
II discusses power supply efficiency standards, technical
feasibility, commercial feasibility, cost and cost-effectiveness,
political feasibility, and concludes with an economist’s
perspective on mandatory efficiency standards.
Finally, in considering the significance of power supply
efficiency, note that the potential to save 47 billion kWh per
year, $4 billion per year, 7,000 MW of baseload generation, and
0.5% of U.S. CO2 emissions is attributable to easily achievable
efficiency gains in a grand total of one technology segment
(electronic devices) in a grand total of one market segment
(residential). Although not discussed in this article, there is a
significant literature on the potential savings from easily
achievable efficiency gains in other major technology segments
(e.g., lighting, appliances, motors, and buildings) across all
three major market segments (residential, commercial, industrial).
In total, the savings dwarf those discussed in this article. What
is missing, however, is the same: market-driven demands for
efficiency and government-directed mandates for efficiency.
Without a dramatic change in these factors, all the technological
improvements in the world won’t make a difference in the long-run.
Introduction
Household electronic devices require a power supply to convert
120 volt alternating current from the wall outlet to lower voltage
direct current. External power supplies are the ubiquitous black
cubes attaching PCs, printers, cordless phones, battery chargers,
video game consoles, and so on to wall outlets. Internal power
supplies are inside televisions, cable & satellite set-top boxes,
microwave ovens, tabletop audio equipment, home security systems,
and so on. The average household has at least 15-20 power
supplies. The most important ones -- in televisions, set-top
boxes, video game consoles, audio equipment, PCs, and printers --
are plugged in at all times.
The key phrase in that last sentence is “plugged in at all
times.” In almost every case, a plugged in power supply is not
“off,” rather it is in standby mode. Standby is what permits the
use of remote controls on audio/video equipment, refreshes cable &
satellite connections, and enables printers and televisions to
warm-up in seconds rather than minutes. Studies done in the late
1990s and early 2000s at Lawrence Berkeley National Laboratories (LBNL)
and other institutions showed that the average U.S. household
draws 60-100 watts in standby.(1) While 60 watts per household is
equivalent to a single incandescent light bulb, 60 watts of
continuous load for an average of 20 standby hours per day
aggregated over all the households in the U.S. exceeds 50 billion
kWh/yr, or more than 3% of all household electric usage. This
raises another obvious question: if more than 3% of all household
electricity is used when electronic devices are “off,” how
efficient are these devices when they are “on”?
Power Supplies and Power Supply Efficiency
A large percentage of the external power supplies in use and on
the market and a smaller but still significant percentage of the
internal ones are inexpensive but inefficient copper- and
iron-based linear power supplies (LPS). Essentially all of these
LPS could be replaced by high-efficiency switch-mode power
supplies (SMPS) using advanced integrated circuit technology.
High-efficiency SMPS can cut standby loads to less than one watt
for most small- to medium-wattage devices (versus a rough average
of 2-3 watts today) and to three watts or less for most
high-wattage household devices versus a range of 5-50 watts today.
Australia, which has the strictest mandatory standards in the
world, estimates that a 1-watt standby limit would ultimately
eliminate about 60% of standby loads versus business-as-usual (BAU).(2)
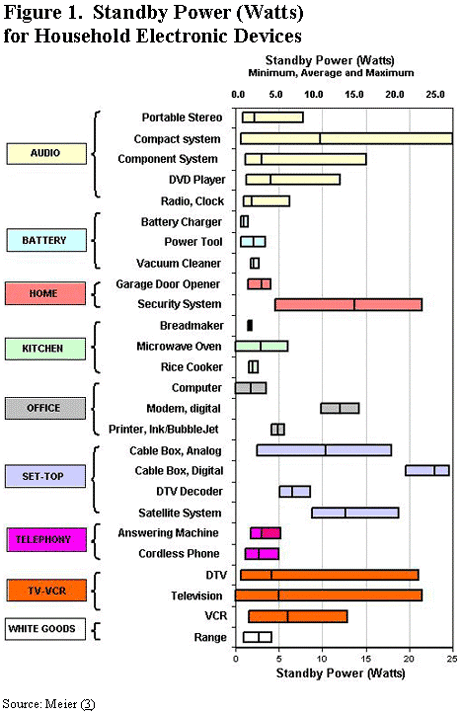
Figure 1, a 2004 update of a 1999 LBNL figure, suggests similar
potential in the U.S.(3,4) It demonstrates that standby loads for
most devices vary by a factor of five or more. This variation
implies enormous avoidable inefficiency since the functional
differences among the devices in each category bear no
relationship to the standby loads. The data also demonstrate that
the most efficient power supplies in almost every category already
achieve standby loads of less than one watt among smaller devices
and three watts among larger devices.

Sixty percent savings in standby is only part of the story. The
same SMPS substantially reduce active loads compared to LPS. The
Environmental Protection Agency (EPA) has developed voluntary
power supply efficiency standards as part of its Energy Star
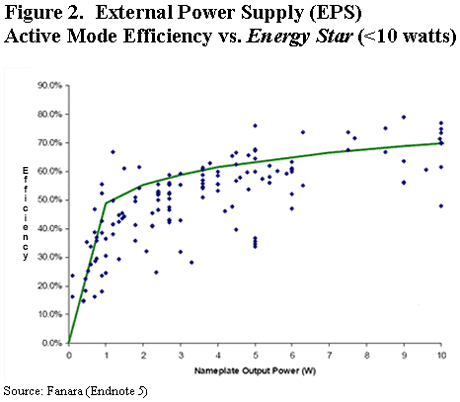
program. Figure 2 compares a scatter plot of single-voltage
external power supplies up to 10 watts (typical of most small
household devices) to the Energy Star standards.(5,6) The figure
shows that 60-70 percent of the power supplies failed to meet the
standards, many by several tens of percentage points. Overall, the
average shortfall is around 10-15 percentage points versus the
standards and around 15-25 percentage points versus the most
efficient units. This demonstrates a very high level of
inefficiency among products on the market. Perhaps more
importantly, the figure shows that a commercially significant
number of power supplies can meet the standards, proving that the
standards are technically reasonable and achievable.
The results are similar for higher wattage power supplies.
EPA’s tests of more than 600 power supplies up to about 160 watts
showed that 36% met or exceeded the standards for active loads,
39% met or exceeded the standby standards, and 23% met both
standards.(7) For the power supplies above 10 watts, the average
shortfall is in the range of 5-10 percentage points versus the
standards and 10-15 percentage points versus the most efficient
units.
Measuring active mode efficiency in power supplies operating at
multiple voltages (especially those for PCs) and most internal
power supplies is more difficult but the results are similar. For
example, Intel recently tested 188 power supplies and found that
95% met its required level of efficiency, 47% met its recommended
level of efficiency, and 5% met its highest level of
efficiency.(8,9) High-efficiency internal PC power supplies exceed
80% efficiency but the average on the market is only 65-70%
efficient.(10)

Total Loads and Avoidable Losses
Household surveys from around the developed world show standby
loads in the range of 40-80 watts.(11) Measurements from 10
California houses published in 2000 found standby loads ranging
from 14 to 169 watts, with an average of 67 watts, or squarely in
the middle of the world surveys.(12) In terms of usage, other
surveys show that for the key loads (PCs, televisions, set-top
boxes, etc.) a good estimate is 4 hours/day active and 20
hours/day standby.(13) If we assume standby in the U.S. averages
67 watts per household, 110 million households, and 20 standby
hours/day, total household standby usage is about 54 billion
kWh/yr. (110 million households * 67 watts/household * 20
hours/day * 365 days = 54 billion kWh/yr.).
In 1998, LBNL published a bottom-up estimate of about 43
billion kWh/yr. for what it termed standby loads for miscellaneous
household devices, essentially all of which would be broadly
defined today as consumer electronics.(14) LBNL also estimated
that demand in this category would grow at a rate of 2.7% per
year. Multiplying 43 billion kWh/yr. by 2.7%/yr. for the period
from 1998 through 2006 produces an estimate of about 55 billion
kWh/yr. today. This calculation almost certainly understates the
actual demand, however, since growth forecasts made in the 1990s
preceded the emergence of such devices as personal video recorders
(e.g., Tivo) and high-definition tuners and preceded the boom in
demand for big-screen flat panel televisions and digital set-top
boxes.
In 2002, the Natural Resources Defense Council (NRDC) estimated
power supply usage at 207 billion kWh/yr. and standby (plus the
related “sleep” category) at 27%, or 56 billion kWh/yr.(15) If we
assume that 15-20% of NRDC’s 56 billion kWh/year was commercial
usage rather than household usage but that overall standby loads
have increased 15% or so since the data reported in 2002 were
collected, then we are back to standby loads of 50 billion kWh/yr
or more.
These estimates are higher than estimates based on Energy
Information Administration (EIA) reports. Using EIA household
usage estimates from 2004 (1.3 trillion kWh),(16) the most recent
EIA estimates for the home electronics percentage (7.2% in
2001),(17) and extrapolating to 2006, we would get total usage
around 1.35 trillion kWh/yr., home electronics usage around 97
billion kWh/yr., and standby usage around 26 billion kWh/yr. This
standby load implies a household average of only about 30 watts,
less than half the measured average in the developed world.
These EIA-implied estimates understate actual loads for at
least three reasons. First, they don’t include small appliances,
power tools, security systems and many other miscellaneous
devices. Second, they don’t fully reflect the rapid increase in
information technology (IT) usage. A recent and detailed analysis
of household IT usage by TIAX calculates loads 40% greater than
EIA’s implied estimates, equating to total consumption in this
category alone of 42 billion kWh/yr. and rising fast.(18) Third,
EIA has not yet captured the transition in home entertainment
devices, as CRT televisions have given way to much bigger flat
panel televisions, small video game devices have given way to
high-powered consoles, and analog and over-the-air television
receivers have given way to high-powered digital set-top boxes,
personal video recorders, high-definition tuners, etc.
Taking these factors into account, the present article
conservatively estimates household standby loads at 50 billion
kWh/yr. and active loads at 125 billion kWh/yr. The 175 billion
kWh/yr. total implies household electronics usage at 13% of total
household usage and rising fast.
Although not addressed in this article, the same type of
analysis implies very large loads and avoidable losses for
commercial office electronic devices (PCs, printers, copiers, fax
machines, modems, etc.), many of which are identical to or
higher-power versions of household devices.
Potential Savings
The literature on power supply efficiency suggests potential
savings of 50-75% in standby, with most figures above 60%.(19,20)
These savings would be achieved by taking the typical 2-3 watt
loads for low-wattage devices to Energy Star standards of 0.5 –
0.75 watts and taking the 5-50 watt loads for higher-wattage
devices to 3 watts or less.
Estimating savings in active mode is more complicated. The BAU
mix in today’s market is not all inefficient linear power
supplies. In the higher-wattage categories and among devices with
design requirements relating to heat, weight, size, or
portability, SMPS already dominate. At the lower-end, LPS occupy a
very substantial share of the market. Overall, this article is
estimating usage-weighted average efficiency of 65% for the BAU
mix on the market today (which includes LPS and SMPS). This
article estimates that a complete conversion to Energy Star levels
(including levels for which the standards are under development,
notably PCs and internal power supplies) would increase usage
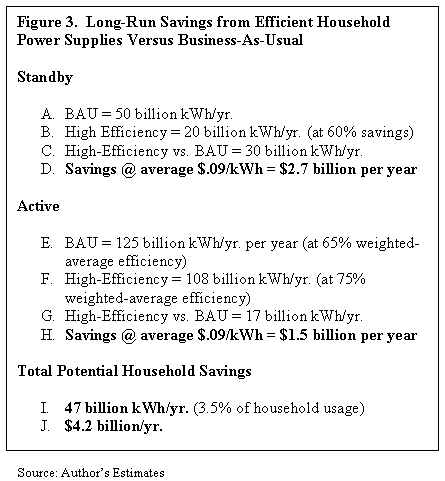
weighted-average efficiency by 10 percentage points. Figure 3
combines the estimated standby and active savings from complete
adoption of high-efficiency SMPS versus the BAU devices now on the
market. Ultimately, the savings reach 47 billion kWh/yr. and more
than $4 billion per year from a 60% reduction in standby loads and
a 10 percentage point increase in average active mode efficiency.
To put these figures in a power generation context, 47 billion kWh
per year exceeds the delivered output of 7,000 MW of baseload
coal-fired or nuclear generating capacity operating at an 80%
capacity factor and subject to average transmission and
distribution losses.

Potential Criticism of Estimated Savings and Response
Critics of the analysis presented here will note that power
supply efficiency is increasing as the market move towards SMPS on
its own and therefore the present article overstates the potential
savings of high-efficiency SMPS. This argument has some merit for
certain information technology devices but very little for home
entertainment devices. In the past decade or so there has been an
exceptionally large increase in loads attributable to the changing
composition of entertainment devices (e.g., big-screen flat panel
televisions vs. smaller CRT televisions) and the quantity of
installed devices. Efficiency gains have been swamped by the shift
towards more devices per household and more wattage per device.
Even in the PC market, which is the major market segment moving
most rapidly towards efficient power supplies, the absolute impact
of new technologies is staggering. The Intel 386 processor used in
the mid- to late-1980s operated at less than 2 watts. Today’s
top-end Intel desktop processor operates up to 130 watts.(21)
Intel estimates that savings from efficient PC power supplies
alone could save 16 billion kWh/yr.(22) High-end video cards for
PC gamers draw 50-75 watts, with cards in the 150 watt range on
the way.(23) The Xbox 360 draws 231 watts, or almost 50% more than
the original 160-watt Xbox and well beyond the typical desktop PC
of 5-10 years ago.
In the entertainment segment of the market, inefficiency
abounds. Standard CRT televisions of the 1990s drew 75-150 watts.
Big-screen televisions today may draw three times as much. In
fact, the difference in usage between the most efficient
big-screen flat panel televisions today and the least efficient
comparable models exceeds the total usage of the largest CRT
televisions of only 10 years ago (i.e., more than 150 watts in
active mode and 30-40 watts in standby mode).(24) A high-end home
entertainment center comprising a cable or satellite digital
set-top box, big-screen HDTV, and a video game console (e.g., Xbox
360) can draw more than 600 watts in active mode and more than 50
watts in standby mode. For comparison, 600 watts is in the range
of radiant electric room heaters. In addition to the huge absolute
loads of the newest top-end televisions, there is the load from
displacement rather than replacement. Very often a new 300-watt
flat panel television enters the house and the old 100-watt CRT
television doesn’t leave but rather moves to another room and
continues to draw standby power.
Part II
Part II discusses power supply efficiency standards, technical
feasibility, commercial feasibility, cost and cost-effectiveness,
political feasibility, and concludes with an economist’s
perspective on the issues.
Part II will be published tomorrow on EnergyPulse.
Endnotes:
1 http://standby.lbl.gov/CEC_Workshop/Docs/CA_Energy_Use.pdf
2 http://www.energyrating.gov.au/library/pubs/2005-projectimpacts.pdf
(Page 23)
3 http://www.kemco.or.kr/up_load/pds/meier%201%20watt-v2.ppt
4 http://standby.lbl.gov/Data/SummaryChart.html
5 http://energyefficiency.jrc.cec.eu.int/pdf/Workshop_Nov.2004/PS%
20meeting/PS%20CoC%20meeting%20101104%20Fanara%20External.pdf
6 Ibid (page 7)
7 Ibid (page 6)
8 http://www.efficientpowersupplies.org/pages/IPS_workshop_Jan06/
Internal_Power_Supply_Workshop_Jan2006_Summary.pdf (Page 8)
9 http://www.extremetech.com/article2/0,1558,1539846,00.asp
10 Efficient Power Supplies.org, Supra, page 9
11 http://www.kemco.or.kr/up_load/pds/meier%201%20watt-v2.ppt
(Slide #5: Silicon Valley 40-200, California 67, USA 60, Australia
80, Japan 50, Europe 40, Urban China 35, Korea 57)
12 http://rael.berkeley.edu/rossmeiernaples.pdf
13 http://www.psnh.com/Household/ReduceBill/Applianceusage.asp
(120 hours active per month = 4 hrs/day)
14 http://enduse.lbl.gov/info/LBNL-40295.pdf (page ii)
15 http://www.nrdc.org/air/energy/appliance/app2.pdf (page i)
16 http://www.eia.doe.gov/cneaf/electricity/epa/epa_sprdshts.html
(1990 - 2004 Retail Sales of Electricity by State by Sector by
Provider (EIA-861), lines 1263, 1387, 1510, and 1633,
respectively.
17 http://www.eia.doe.gov/emeu/reps/enduse/er01_us.html
18
http://www.tiaxllc.com/reports/resid_info_tech_energy_consump_2006.pdf
19 http://rael.berkeley.edu/rossmeiernaples.pdf
20 http://www.standardsasap.org/candidate.pdf
21 http://www.silentpcreview.com/article308-page1.html
22 http://www.extremetech.com/article2/0,1558,1539846,00.asp
23 http://www.silentpcreview.com/article227-page2.html
24
http://reviews.cnet.com/4520-6475_7-6400401-3.html?tag=txt
To join in on the conversation or to subscribe or visit
this site go to: http://www.energypulse.net
Copyright 2005 CyberTech, Inc.
|

