The EU's Carbon Market Dilemma
Location: Washington, D.C.
Author:
Kjetil Roine and Henrik Hasselknippe
Date: Thursday, June 21, 2007
While 2005 in many ways marked the birth of the global carbon market, 2006 represented both a rude awakening and a fresh start. The European carbon market came under massive criticism following the price collapse in April/May last year, when it became clear that far too many allowances had been handed out by European governments. But the publication of the 2005 data also provided the market and policy makers with something that had been lacking—a set of reliable data to base political and trading decisions on.
Despite the severe problems with the allocation of allowances in the first phase of the EU’s emissions trading scheme, the market is moving on. The allocations for the next phase (2008-2012) are considerably stricter than those for the first phase. The publication of market sensitive information has also been taken several steps forward, although there is still some way to go before the carbon market deals with information release in the same way as more mature financial markets.
Secondly, the results from our carbon market survey suggest that the EU ETS is starting to work as it should, by initiating internal abatement and bringing companies to the market to benefit from these abatements. We also find that there are many more companies now using the market actively, with about 36 percent of respondents to our survey citing trading in the EU ETS as their prime strategy for meeting their emission targets.
Finally, we now find it increasingly likely that we will see a truly global carbon market emerging soon. Developments in the U.S. and Australia suggest that we will soon see operational emission trading schemes established in these countries. With every one of these systems relying on offset opportunities from projects in other parts of the world, it is inevitable that we will soon see the emergence of common carbon prices. It will still take some years before we see exactly what this market will look like, but its contours are quickly becoming visible.

The international carbon market is a direct consequence of the Kyoto
Protocol, an international agreement on climate change that assigns
mandatory limits on greenhouse gas emissions to the signatory nations.
As of December 2006, the Kyoto Protocol covered more than 169
countries and an estimated 55 percent of global greenhouse gas
emissions. While there is carbon trading also in countries that did
not sign the protocol, the market is to all extents and purposes based
on the mechanisms specified in the Kyoto protocol. The carbon market’s
mission is to place a cost on carbon emissions through the allocation
of allowances and a value on emission reductions via offset credits,
and to enable trade of the resulting allowances or credits. One of the
main mechanisms for achieving this goal is the creation of trading
schemes for emission allowances.
At the present time, the European Union’s Emissions Trading Scheme is the only operational trading scheme that is operating on a regional scale. The EU ETS works, simply put, by placing greenhouse gas emission limitations on approximately 10,000 installations within specific sectors (power and heat, metals, cement, lime and glass, oil and gas, pulp and paper) and allowing the emission targets to be met through trading of EU emission allowances.
The first phase covers the three years from 2005 to 2007. The foundation of the trading scheme is set by “national allocation plans” developed by each member state of the EU that outlines the level of allowances to be issued (the caps) and the allocation of allowances to sectors and individual installations. The European Commission has approved in total 6.3 billion allowances for the period 05-07, excluding allowances set aside for new installations, resulting in an average of 2.1 billion allowances to be distributed each year. The allowances cannot be carried into the second phase.
The second phase of the EU ETS coincides with the compliance period established by the Kyoto Protocol. It will start in January 2008 and extend through December 2012. The European Commission is currently assessing the national allocation plans submitted by each country for Phase II. Generally, a larger part of the total emissions in Europe will be covered by the EU ETS in Phase II than in Phase I. The EC has basically two objectives when assessing the national allocation plans and setting the caps: i) to ensure compliance with the targets under the Kyoto Protocol and ii) to avoid over-allocation. We estimate that the caps will be reduced by about 10 percent compared to the numbers suggested by the member states.
The EUA price is, as in any market, set by supply and demand. The supply is here determined by the allowances and carbon credits available to the market. Demand is set by the amount of emissions through the year in relation to the overall allocation. The demand is influenced by a number of factors, primarily fundamentals like weather (as temperature determines power/heat demand and precipitation the potential for hydropower production) and fuel prices (as the relative price differential between coal and gas will determine which of the fuels that will be used for power production). Relatively cheaper coal compared to gas will increase carbon emissions as more power production will be based on coal which emits more carbon per unit of output than gas. Higher CO2 emissions will increase the carbon price.
The Dec-07 contract (for delivery in December 2007) began the year at €22.70, and was traded by the end of the year more than €16 lower at €6.55, the year’s lowest value. Its highest value was on April 19 at €31.58, just before crashing on the haphazard release of verified emissions data to €9.70 on May 11. The market has now fully internalized the excess allocation, and prices are currently trading around €0.50.

Activity in 2006 2006 saw, as in all previous years in the carbon
market, a substantial growth in the traded volumes and corresponding
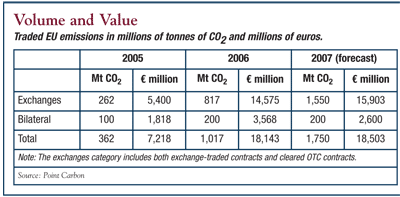
values. We estimate that the EU ETS saw a total volume of 1,017
million tonnes of CO2 in 2006. This includes confirmed transactions
for 583 million tonnes conducted over-thecounter through brokers and
234 million tonnes on various carbon exchanges.
In addition to the trading activity on exchanges and through brokers there is a direct bilateral market, with transactions executed directly between two companies. Estimating this bilateral market is difficult as such deals are rarely, if ever, reported. We estimate the direct bilateral activity to account for 20 percent of all EU ETS trading activity in 2006, or about 200 million tonnes CO2.
The European Climate Exchange still carries the largest volume of the exchanges, with over three quarters of all exchange volumes (not including exchange-for-physical, where OTC transactions are cleared through the exchange). Powernext (13.3 percent), in second place, is still almost twice as large as Nord Pool (7.4 percent), while the only other exchange with volume to speak of is the European Energy Exchange (3.6 percent).
There was notable development towards relatively more volume on exchanges in the fourth quarter, coinciding with the declining Phase I price. Much of the increase came through spot trading, possibly indicating more industrial selling in this period, but also of course a natural increase in trading activity was as the year-end approached.
Most of the trades in 2006 were for Phase I delivery, although the relative share of Phase II volume increased steadily throughout the year. In total over the year, Phase II accounted for 24.4 percent (199 million tonnes) of the volumes done on exchanges and through brokers. Most of this, 143 million tonnes, came in the last half of the year.
In financial terms, the EU ETS volumes on exchanges and through brokers totalled €14.6 billion last year, of which €10.8 billion came through allowances for delivery in Phase I. This is about three times more than the exchanged and brokered value from the previous year (€5.4 billion), and a whopping two hundred times more than in 2004.
The financial value of the direct bilateral volume is difficult to assess, as there is no way of knowing how much of it that was in Phase I delivery and how much that was in Phase II. We estimate that the direct bilateral market saw values of €3.6 billion throughout the year, bringing the total estimated financial value of the European market in 2006 to €18.1 billion.
The development throughout the year shows that volumes went down in the third quarter, both as a result of stabilizing prices after the Phase I price crash in the second quarter, and the slow summer months when trade activity is usually lower. In the last quarter of 2006 the volumes went back up, registering the highest quarterly level of activity ever. This was a result of increased industrial selling towards the end of the compliance year, as well as interest in Phase II taking off in response to the first set of NAP announcements for the 2008-2012 period.

To arrive at our expectations for 2007 we first need to specify the
assumptions behind our volume forecast. We expect Phase I activity to
die out as the year closes and compliance needs fade away, leaving a
lot of industrials with excess allowances and no buyers to pick up the
length. Our second assumption on EU ETS volumes in 2007 is that most
of the activity shifts to Phase II. This would be a direct
continuation of the trend seen so far, and we expect activity to
increase further once most of the allocation plans are finalized. We
could also see more liquidity providers entering the market, many of
them returning after having burnt their fingers on Phase 1. We also
expect to see more of the mid-ranking operators entering the carbon
game early on.
The start of 2007 has seen daily traded volumes averaging at 4.8 million tonnes/day. A simple continuation of this would lead to over 1,100 million tonnes for the year as a whole. Actually, we expect trading activity to increase throughout the year, as the interest in Phase II trading takes off. Accounting for lower activity in the summer and daily volumes approaching 7-8 million tonnes/day towards the end of the year, we estimate the total volume for 2007 to be 1,550 million tonnes, essentially a doubling from OTC and exchange volumes in 2006. Including the elusive direct-bilateral volumes at 200 million tonnes we forecast total trading activity in 2007 at 1,750 million tonnes.
Based on current prices (€0.50/t for Dec- 07 and €19.00/t for Dec-08) and that 400 million tonnes of the total will come in Phase I allowances, we find that the financial value of the brokered and exchange market could reach €15.9 billion for the year ahead. Assuming that much of the direct-bilateral volumes will come in Phase II allowances this would bring the total financial value to €18.5 billion, based on current prices. This is not much of an increase from 2006, but is due to the relatively low prices.

To subscribe or visit go to: http://www.riskcenter.com