Probability of Bank Default Hits 1987 Crash Levels
Location: Chicago
Author:
Eric C. Banfield, FRM, CRP, PRM
Date: Thursday, November 29, 2007
Brace for bank defaults: The money market is sending up warning signals.
Major banks borrow and lend to each other in the interbank euro-deposit market, at various maturities. The interest rates on those deals reflect general money-market and credit-market conditions. The British Banker’s Association’s “fixing” of London Interbank Offered Rates (LIBOR) take a mid-morning snapshot of those market rates from a daily survey of banks. The risk premium in LIBOR over risk-free rates indicates the risk of default among the participants in that interbank market.
Given the 3-month (risky) interbank rate LIBOR and the 3-month (default-risk-free) Treasury bill rate, we can at any point in time approximate the market's current, forward-looking. expected probability of default (PD) for major banks during the next three months (about a quarter of a year) by
PD = 1 - [(1+TBillRate%/4) / (1+LIBOR%/4)]
The long-run average PD is 0.10%, which (crudely applying the square-root-of-time rule) would correspond roughly to about a 0.20% probability (1 in 500 chance) over a full-year period.
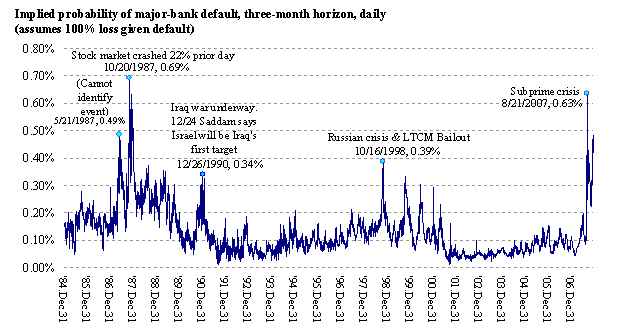
Plotting that calculated PD over the past 22 years, we see that chances of a major-bank default in the next three months rose in August to levels (0.63%, or 1 in 160 chance) not seen since the 1987 stock-market crash.
Fig. 1. Implied probability of major-bank default

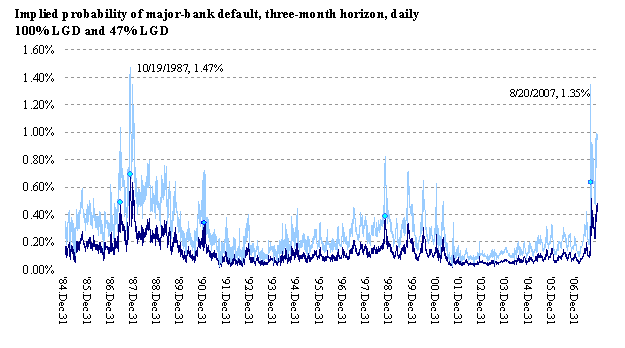
Actually, those historical PD values probably understate the risk. They implicitly assume that a default means the lender loses 100% and recovers 0%. But that is not consistent with experience. The risk premium actually includes the market's expectation that it will lose less than 100% in the event of default. That means the risk of the default event is actually higher than indicated above.
Applying an historical 47% loss-given-default (LGD) figure*, we can see the odds of a major-bank default recently went well over 1.00%.
Fig. 2. Implied probability of major-bank default, adjusted for LGD

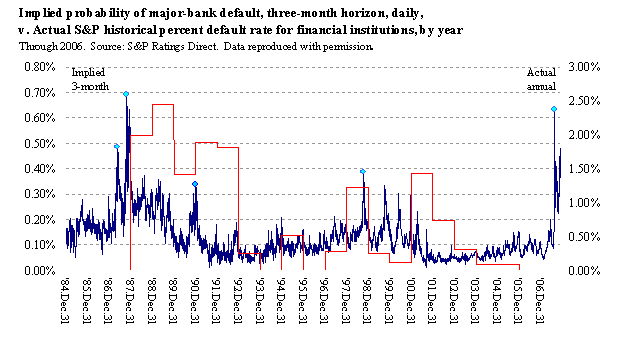
Even using the 100%-LGD-based measure (understating the risk), the current PD level is 0.48%, still worryingly high. Why? Figures in the 1/2% to 1% range might not sound that scary. But history shows that spikes in the forward-looking spread-based three-month PD measure do tend to align with -- or more often be followed by -- actual financial-institution defaults (annual values, in red, right scale **). Of course, not all financial institutions are banks, and banks do tend to get bought out or bailed out before actually defaulting.
Fig. 3. Implied probability of default v. actual default rates

Let's hope the odds don't play out this time and that the market's fears are overblown. Otherwise, it's going to get ugly for someone.
* Michael Aratan, Michael Jacobs Jr., and Peeyush Varshney, "Measuring LGD on Commercial Loans: An 18-year Internal Study," The RMA Journal, May 2004, pp. 96-103,
** Vazza, Diane, and Devi Aurora. Annual 2006 Global Corporate Default Study And Rating Transitions, Table 9., pp. 14-15 (of 51 pp.). Copyright Standard & Poors Global Fixed Income Research. This report is available to subscribers of RatingsDirect Global Fixed Income Research, the real time Web-based source for Standard & Poor's credit ratings, research, and risk analysis, at www.ratingsdirect.com .
For more details on RatingsDirect or default information please contact SI_marketing@standardandpoors.com. Material reproduced with permission of Standard & Poor's, a division of The McGraw-Hill Companies, Inc.

To subscribe or visit go to: http://www.riskcenter.com