| 9.4.07 | Chris Neil, Energy Economist |
On June 21, 2007, the Senate passed H.R. 6, the Renewable Fuels, Consumer Protection, and Energy efficiency Act of 2007. This Senate Bill, as it is referred to here, was hailed as a major political victory in efforts to address national security and global climate change. This article provides a rough, quantitative analysis the US’s carbon dioxide (CO2) emissions reduction that might occur as a result of the Senate Energy Bill. The Senate Bill is compared with the CO2 reductions from a moderately aggressive plan that reaches the Kyoto target emissions level by 2030. Thus, this article shows the emissions trajectory of the Senate Bill and a sector-by-sector comparison of where the bill achieves CO2 reductions and identifies sectors where additional reductions might be possible. Reducing U.S. CO2 emissions is a challenging task. It is difficult to achieve the goal of reducing emissions without addressing every source of emissions. While the Senate Bill may not be intended to address every sector, it is helpful to show where it does and does not address emissions reductions.
The Base Case and Comparison Case
The base case used here is the reference case Annual Energy Outlook 2006 (AEO 2006) from the Energy Information Agency at the U.S. Department of Energy.(1) This case includes little in the way of emissions reduction, and thus provides a good basis for illustration emissions reductions from new programs. AEO 2006 is also used as the base case because the energy and emissions model used in this analysis is derived from it. CO2 emissions in the AEO 2006 reference case are similar to those in AEO 2007 – CO2 emissions are approximately 2% different in 2030.
The comparison case is from the article titled The Utility Plan for Addressing Global Climate Change by this author.(2) This is referred to as the “Neil/Utility Plan” and illustrates a path doe reducing US CO2 emissions in 2030 to 7% below the 1990 level. This case was a development of studies from Global Insight(3)(4) and an earlier article by this author.(5)
Sector by Sector Analysis
Emission reductions are summarized in nine principal energy using sectors that are discussed below. This discussion includes the specific values used in the analysis. In many cases, the appropriate level to include in the analysis is subject to interpretation. The basis for the choice used here is explained, but it may be that the bill was not completely understood and a different value should be used. The impact of the legislation is often based on summaries of the legislation rather than a detailed reading of all 464 pages of the Senate Bill. In some cases, the Senate Bill is not given credit for an emissions reduction in a sector. More than 100 energy-related bills have been presented in congress. The final energy plan will include more than just what is in the Senate Bill. While the analysis here focuses on the Senate Bill, impacts could be addressed in other legislation.
1. Energy Efficiency in Electric-Consuming Equipment
Energy efficiency is generally acknowledged as the first step and the most cost-effective step to be taken in addressing climate change. The Senate Bill advances national efficiency standards and requires (but does not provide funding) the reduction of energy use in federal buildings. AEO 2006 is considered the base case for emissions. The Neil/Utility Plan reduces electric-related power need by 10% from the AEO 2006 level through a combination of appliance efficiency standards and utility programs and incentives. The Senate Bill does not appear to include a strong program of joint government-utility energy efficiency efforts. The Senate Bill’s federal programs also appear weaker than they could be. Because of these issues, the Senate Bill is modeled with half the emissions reduction of the Neil/Utility Plan. These energy efficiency efforts under the Senate Bill are assumed to reduce the growth rate in electricity demand from about 1.5% per year under AEO 2006 to about 1.3% per year from 2007 until 2030.
2. Renewable Generation
The Senate Bill includes neither an extension of the renewable generation production tax credit (PTC) nor a national renewable portfolio standard (RPS). The senate debated inclusion of a 15% national renewable portfolio standard, but this feature was not included in the final bill. For modeling and illustration purposes, therefore, the Senate Bill is shown as having no additional emissions reductions due to renewable generation beyond those in AEO 2006. This understates the impact of renewable generation, because the PTC has been extended and because of state RPS, but reflects the impact of the Senate Bill. The Neil/Utility Plan includes a 15% national renewable portfolio standard by 2025.
The reason that a renewable portfolio standard was not included in the Senate Bill was reportedly that the Southeastern states are not in favor of it because of the lack of wind in that part of the country. An analysis of wind generation potential indicates that this is indeed a concern in the Southeastern U.S., and this was one of the reasons that the renewable portfolio standard was reduced from 20% to 15% from the earlier version of the author’s modeling published in October, 2006 to the Neil/Utility Plan version published in May, 2007.
EIA analyses, however, indicate that biomass is a more cost-effective form of renewable generation than wind and should be available in the Southeastern U.S. It may be difficult to reach the 15% level without wind, but some level of renewable portfolio standard can be achieved in all parts of the country.
The Senate Bill requires federal facilities to obtain 10% of their power from renewable generation sources by 2010 and 15% by 2015. While this would provide a small amount of additional renewable generation compared to AEO 2006, these unfunded mandates are difficult for federal facilities and the utilities that serve them.
Renewable generation is also an important part of an emissions reduction strategy because renewable generation resources can be deployed earlier than many other emissions reduction technologies. Nuclear and corporate average fuel economy standards, for example, require a long lead time before they can be implemented and achieve significant emissions reductions. Renewable resources are the technology that can be implemented in the near term and that can demonstrate to the world the U.S.’s commitment to emissions reduction. Development of a national renewable portfolio will be a challenge given the variability in renewable energy resources in different parts of the country, but renewable generation is a critical component of a comprehensive emissions reduction strategy.
3. Nuclear Power
The Senate Bill extends the Price-Anderson Act insurance for nuclear accidents, but does not otherwise provide incentives for nuclear power. AEO 2006 includes six new nuclear generating units between now and 2030 in response to incentives in EPAct 2005 (six total, not six per year). The Neil/Utility Plan assumes that U.S. nuclear generation is doubled by 2030 through the construction of five new units per year from 2015 to 2030. The Electric Power Research Institute (EPRI) has developed a plan similar to the Neil/Utility Plan and includes four new nuclear units per year.
For modeling purposes, the Senate Bill is (generously) assumed to have the same level of nuclear generation as the Neil/Utility Plan. While there may not be a great deal of additional incentives required in order to achieve significant emissions reductions due to new nuclear generating units, a comprehensive energy bill should address nuclear. Nuclear is one of the key emissions reduction technologies in the power generation sector. Energy reductions from nuclear were included in the modeling to demonstrate that significant emissions reductions could be achieved with a little more effort in this part of the bill.
4. Carbon Capture and Sequestration at Coal-Fired Power Plants
The Senate Bill continues the government’s effort to develop carbon capture and sequestration technologies. The Senate Bill is modeled, therefore, as having the same emissions reduction due to carbon capture and sequestration as the Neil/Utility Plan. The Neil/Utility Plan includes FutureGen in 2012, an average of 1,000 MW of carbon capture and sequestration from 2015 to 2019, and 2,000 MW per year from 2020 to 2030. AEO 2006 does not include any CO2 emissions reductions due to carbon capture and sequestration.
5. Plug-In Hybrid Vehicles
The Senate Bill includes research funding for batteries for plug-in hybrid vehicles but does not include further incentives or targets for plug-in hybrid vehicles. To the extent that plug-in hybrids are included in the Senate Bill, they are reflected in the 35 mpg corporate average fuel economy standard discussed below.
It may be appropriate to include plug-in hybrid vehicles at a later date. Plug-in hybrid vehicles are not commercially available at this time and the schedule for their commercial availability is not known. It might be considered premature to include plug-in hybrid vehicles prior to their commercial availability. Once this option
AEO 2006 does not include any emissions impact due to plug-in hybrids while the Neil/Utility Plan includes a substantial impact from plug-in hybrid vehicles. The Neil/Utility Plan includes 10.5 percent of new vehicles are plug-in hybrids by 2014 and 22% of new vehicles beyond 2020 are plug-in hybrids. The impact of plug-in hybrid vehicles is incorporated in the corporate average fuel economy standards of 40 mpg in 2014 and 50 mpg in 2020. Emissions to charge the batteries overnight are included in the generation technologies.
6. Corporate Average Fuel Economy (CAFE)
The Senate Bill includes a 35 mpg CAFE standard in 2020 that applies to both cars and trucks. There was an effort to increase the standard by 4% per year after 2020, but this was not included in the final bill (and would also have made the modeling more complicated).
The Senate Bill would have a greater impact if an intermediate mileage increase were included, some time in the 2010 to 2020 timeframe. Trucks already have increases scheduled, so it would be logical for cars to also have an increase.
AEO 2006 includes a slight increase in the average fuel economy of vehicles. The Neil/Utility Plan includes a 33 mpg CAFE standard in 2014 and a 36 mpg CAFE standard in 2020 for conventional (non-plug-in) vehicles.
7. Biofuels
Biofuels are universally considered an attractive target for the future. The Senate Bill includes 36 billion gallons of biofuels by 2022. Assuming that this continues to increase, biofuels are modeled as reaching 53 billion gallons in 2030.
AEO 2006 includes 12 billion gallons of ethanol by 2030 based on EPAct 2005. The Neil/Utility Plan includes biofuel production reaching 34 billion gallons in 2022 and 46 billion gallons per year (3 million barrels per day) in 2030.
The Senate Bill mandates that most of the biofuel production in the later years is advanced biofuel such as cellulosic ethanol, but does not provide additional funds for achieving this goal. As stated above, these unfunded mandates are difficult to achieve.
8. Other Transportation
Other transportation consists of freight trucks, busses, trains, airplanes, pipelines, etc. The Senate Bill appears to include biodiesel in its biofuels sector. The summaries do not show the Senate Bill addressing other transportation through other means. As a result, the Senate Bill is modeled is not changing emissions in this sector. Without being specific, the Neil/Utility Plan assumes a 25% reduction in emissions from this sector compared to AEO 2006.
9. Residential, Commercial and Industrial Energy Efficiency
This sector consists of direct (non-electrical) use of natural gas, oil and coal. One of the biggest emissions reductions in the Senate Bill may have come from what was not included in the Bill. The final version of the Senate Bill excluded incentives for coal-to-liquids development. Coal-to-liquids has significant energy security and financial benefits because it reduces imports of oil. Coal-to-liquids development, however, has about twice the emissions as conventional oil production unless the emissions are captured and sequestered. Thus, the development of coal-to-liquids is a difficult choice between energy security and greenhouse gas emissions.
AEO 2006 includes a significant amount of coal-to-liquids development, and AEO 2007 includes even more coal-to-liquids. EIA’s modeling indicates that coal-to-liquids is cost effective given future energy prices. This cost-effectiveness would be further enhanced by the incentives that were considered in the Senate Bill discussions. It is not clear, however, whether the lack of these incentives will preclude coal-to-liquid development. In order to take an optimistic approach, this modeling assumes that coal-to-liquid technology is not widely adopted. Like the Neil/Utility Plan, a 25% reduction in emissions in this sector under the Senate Bill is included.
Results
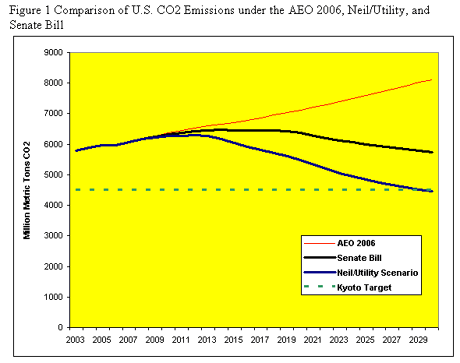
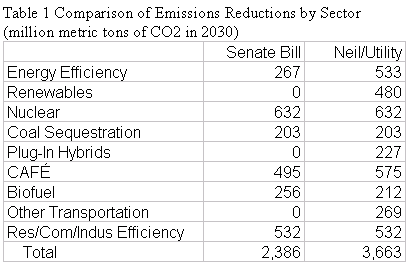
The emissions trajectories of the Senate Bill, the Neil/Utility Plan, and AEO 2006 are compared in Figure 1. As indicated above, the Neil/Utility Plan achieves emissions level in 2030 that approximates the Kyoto target of 7% below the 1990 emissions level. As shown in Table 1, the Senate Bill achieves about two-thirds of the reductions required to reach the Kyoto Target of 7% below 1990 emissions. Emissions under the Senate Bill would stop increasing and start to decline. The decrease is simply not as significant as it would be if every sector were addressed.


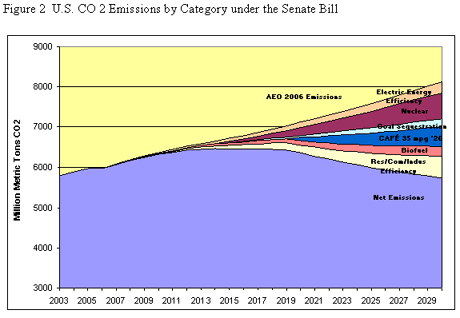
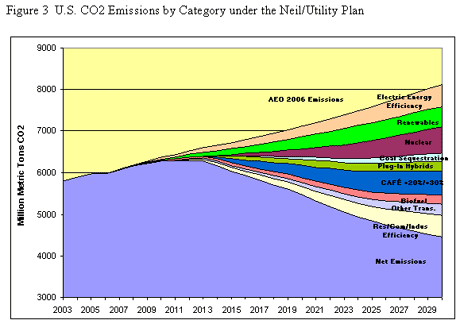
The Senate Bill and Neil/Utility Plan are illustrated in Figures 2 and 3 with the major emissions sectors broken out in the form of Pacala-Socolow type stabilization wedges. These show the path through time as well as the magnitude of the emissions reduction impact of each sector that is addressed. In the Senate Bill, nuclear accounts for about one-quarter of the overall emissions reduction in 2030, the CAFÉ standard and other energy efficiency account for about one-fifth, and electric energy efficiency, coal sequestration and biofuels each account for about 10% of the total reduction. By major type of energy use, all the electricity-related emissions reduction measures account for 46% of the overall reduction in the Senate Bill, transportation-related emissions reductions account for 31% of the total, and other energy accounts for about 22% of the total.


Conclusion
The Senate Bill represents a notable achievement on a difficult political issue. The analysis and assumptions used here indicate that significant reductions US global greenhouse gas emissions can be achieved if there is the political will.
The Senate Bill could achieve greater emissions reductions if a little more was included in it, however. Obviously, a renewable portfolio standard is needed in comprehensive energy legislation. More of a nudge is needed for energy efficiency and new nuclear plants. When plug-in hybrid vehicles are available, significant emissions reductions could be obtained by adding them to the list.
The opinions expressed here are solely those of the author and do not reflect those of any other organization.
References:
1. Energy Information Agency, US Department of Energy, Annual Energy Outlook 2006, http://www.eia.doe.gov/oiaf/archive/aeo06/index.html, Feb, 2006
2. Neil, Chris, The Utility Industry's Approach to Global Climate Change,
EnergyPulse,
http://www.energypulse.net/centers/article/article_display.cfm?a_id=1488
May 23, 2007
3. Lindemer, Kevin and Gil Rodgers, A Scenario for Reducing Greenhouse Gas Emissions, U.S. Energy Price Outlook, Global Insight, Winter 2005-06, p. 17.
4. Global Insight, Addressing Global Climate Change: Is the U.S. at the Tipping Point, in U.S. Energy Outlook 2006, p. 7-16
5. Neil, Chris, A Low-Cost Solution to Global Climate Change – Part I and Part II, EnergyPulse, Oct 5 and 6, 2006, http://www.energypulse.net/centers/article/article_display.cfm?a_id=1345 and http://www.energypulse.net/centers/article/article_display.cfm?a_id=1346
6. See, for example, http://www.nytimes.com/2007/06/22/us/22energy.html?ex=1340164800&en=c11a3f59aa381de1&ei=5088& partner=rssnyt&emc=rss, http://energy.senate.gov/public/index.cfm?FuseAction=PressReleases.Detail&PressRelease _id=235326&Month=6&Year=2007&Party=0 http://www.npr.org/templates/story/story.php?storyId=11276443 http://democrats.senate.gov/dpc/dpc-new.cfm?doc_name=fs-110-1-107 http://democrats.senate.gov/energy/act/efficiency.cfm http://democrats.senate.gov/energy/act/ http://democrats.senate.gov/energy/
7. Pacala, S. and R. Socolow, Stabilization Wedges: Solving the Climate Problem for the Next 50 Years with Current Technology, Science, Vol 305, August 13, 2004, p. 968-972.
There is much interesting discussion that follows this article at:
![]()
Copyright © 2002-2006, CyberTech, Inc. - All rights reserved.