| 1.24.08 | Christopher Russell, Principal, Energy Pathfinder Management Consulting, LLC |

Payback, of course, is a measure that describes the number of years that it takes for an investment to "pay for itself" through the annual savings or benefits that the investment creates. To calculate it, one merely divides the total cost of a proposed investment by the annualized net savings (or benefits) that the investment will provide.
One problem with payback is the conceptual “blinders” worn by its users. By this, we mean the fact that managers will commit to memory the payback that was calculated at a specific point in time for a project proposal, for example: “That boiler upgrade is a five-year payback.” Let’s say that result was true in 2002 when natural gas cost $3 per MMBtu. That payback calculation was dramatically shorter in 2006 when gas prices topped $8.
Similarly, interest rates vary every day. As a result, so do an organization’s cost of capital and the profitability of its operations. However, most organizations do not allow their payback criteria to vary with interest rates. Why? Because payback measures time, not the cost of money or the profitability of an investment. While interest rates change daily, production targets and budgets remain fixed in an annual format. By providing a measure of years, simple payback fits naturally with the priorities of a manager whose performance is measured by annual criteria.
Is simple payback is the right calculation for evaluating proposed energy improvements? If not, what questions that should be asked about such investments and how best should those questions be answered?
Think about why we perform financial analyses in the first place. Whenever a business invests in itself, it implies making a change. With change comes risk. Before committing money to creating change, top managers will want to know the risk of losing their investment, or at least the risk of failing to invest in more valuable alternatives.
Here’s how payback measures can frustrate energy management efforts. The greater the investor’s concern with investment loss, the shorter the payback time demanded. For example, a 12-month payback is preferred to a 24 month payback, and a 6-month payback is preferred to a 12-month payback. Now take this to its logical conclusion: a zero-month payback would be most preferred—because there’s no wait to get the money back! The investor is assured of avoiding loss only by making no investment at all. Payback, as a risk management tool, only indicates if the investor should part with the money. It reduces investment analysis to a “yes/no” decision. As a consequence, energy management becomes a stop-and-go process. The company's beleaguered energy manager has to reset his or her agenda back to zero with each project rejection.
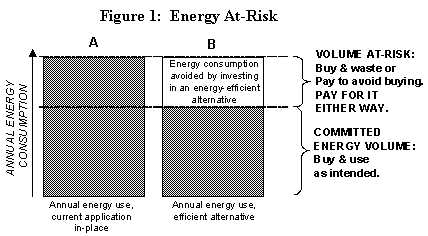
Energy improvements need to be evaluated by a different standard. Why? Because once a business commits to operations, it commits to using energy. All organizations experience energy waste, and some portion of that waste can be economically avoided. This portion is the energy at-risk. This concept presumes the following about energy-consuming business facilities:
- Energy consumption can be divided into a proportion that is purchased and used as intended (committed energy), versus the proportion that is currently wasted.
- Energy waste that can be economically avoided is energy at-risk.
- The facility WILL PAY for energy at-risk, by either purchasing it, or paying the cost to avoid it.
The energy at-risk concept is depicted here:

When considering the implementation of a specific energy improvement, the business choice is simple, as shown in the figure above: either (A) continue buying the energy at-risk at the prevailing price, or (B) implement an energy-reducing improvement when the cost to save energy on a per-unit basis is less than the price to purchase it.
Now here’s what we want to do: develop a management tool for making energy cost-control decisions. This tool needs to compare the financial merit of implementing energy improvements to simply continuing to buy and waste the portion of energy at-risk as described above. Also, this tool needs to account for the organization’s cost of capital and fit logically with the annual parameters that shape budget and performance accountabilities. That tool is the save-or-buy calculation.
The save-or-buy calculation requires the annualization of all relevant cash flows and investments, so that costs and benefits can be correctly compared on an “apples to apples” basis. As discussed above, most financial targets, measures, and budgets are already expressed on an annual basis. The total costs of large assets that will be in service for more than a year are typically financed over an equivalent number of years. To express the value of these investments as an annual equivalent, we use amortization—a calculation that organizes an investment’s capital and interest costs in a series of annual payments of fixed amount. (1)
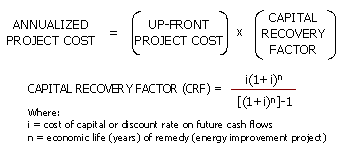
The cost to save a unit of energy is calculated in two steps. First, determine the total up-front cost to implement a specific energy-saving initiative, and annualize that project cost as follows:

The second step is to distribute the annualized project cost over the volume of first-year energy savings (in units such as kilowatt-hours, therms, gallons of oil, etc.) that the project provides:

Let’s be absolutely clear about this: use payback when the alternative to investment is to keep the money. This is not the situation for an investment that reduces avoidable energy waste—because the alternative to the investment is to continue buying the energy that will be wasted! Proposed energy improvements should be evaluated by comparing the annualized cost to save a unit of energy to the delivered price per unit for buying that same unit of energy.
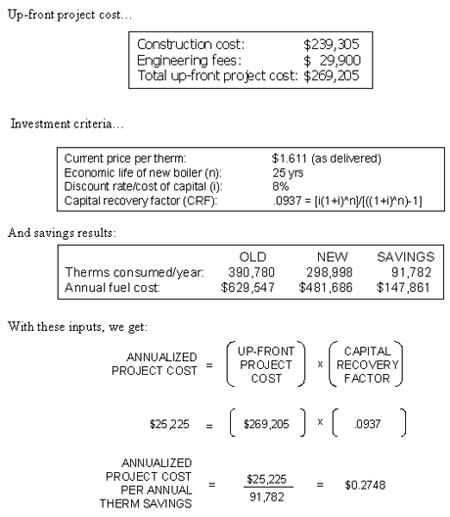
An example. A manufacturing plant contemplates replacing its current boiler and steam system. While it appears that the current system could continue functioning for the foreseeable future, its efficiency has nonetheless been compromised by age and neglect. The boiler consumes natural gas (measured in therms). The relevant investment data is shown below.

In this example, the investor has two choices: continue to buy the energy at-risk (91,782 therms) at the current price of $1.611 per therm, or pay an annualized cost of $0.2748 per therm avoided as the result of investing in the boiler replacement. The ratio of the price to buy versus the cost to save each unit of energy at-risk provides a cost-benefit measure:

Stated differently, this project would allow the investor to pay $0.17 to avoid buying a dollar’s worth of energy.
Note that the annualized cost to save a unit of energy effectively amortizes project costs, so that the annual budgeted value remains constant over the economic life of the project. Amortized project costs can be budgeted each year with certainty. In contrast, volatile energy prices will make it a chore to budget for energy purchases.
In sum, an energy-consuming organization has one of two choices for the at-risk portion of their energy consumption. They are:
- Buy it. The facility chooses not to make the energy
improvement. It will continue to buy more energy than it needs to
accommodate its waste. For whatever reason, the organization is not
motivated to change.
- Save it. Alternatively, the facility can implement efficiencies that allow the recapture of energy waste so that it can be re-applied to useful purposes. By “recapture,” we mean anything that reduces the loss of energy. Recaptured energy allows the facility to reduce its energy purchases by a corresponding amount.
Simple payback does nothing more than suggest how long it takes for an investment to pay for itself from the savings it provides. It cannot indicate profitability, so it is useless as a tool for comparing the financial performance of alternative investments. The most practical use of simple payback is to measure the risk of making an investment when the other alternative is to simply keep the money and not make an investment. As this article explains, once a business decides to operate, it commits to using energy, so “keeping the money” is no longer an alternative. It will either buy and waste the energy at-risk, or it will pay to reduce that volume of consumption. The save-or-buy criterion is the decision tool for making that choice.
Reference:
(1) To get really technical about it, investments should be amortized on a monthly basis. The annual expense is then the sum of 12 monthly amortized values.
![]()
Copyright © 2002-2006, CyberTech, Inc. - All rights reserved.