Why Energy Has Become a Competitiveness Challenge
Energy is indispensable for economic growth in the 21st century, but as more nations develop, competition for those resources is intensifying. Can the US ensure access to energy resources as exporting nations vigorously assert their interests and developing nations leap into the fray?
THE UNITED STATES BUILT THE LARGEST economy in the world during the 19th and 20th centuries using domestic energy and mineral resources. Early in the 21st century, the country still has the largest economy but is increasingly dependent on internationally-sourced natural resources to maintain and grow its GDP. As a consequence, the US is locked in competition for energy resource access and security with the other OECD1 countries and BRICs2 with similar energy import requirements. All are dependent on a small but increasingly vocal group of energy exporting countries. Consuming countries' failure to insure their energy security may lead to declining growth rates, diminished standards of living, and growing transfer of wealth from importing to exporting countries.
For purposes of clarity we choose the term energy security, rather than energy independence, and define it as a country's unfettered access to energy (oil, natural gas, and coal) and associated strategic materials (aluminum, copper, nickel and chromium, for example) at market prices that reflect the cost to produce plus an acceptable rate of return to the producer and the host government. Energy independence, while an attractive concept, is not presently achievable for most OECD countries3.
Energy and GDP
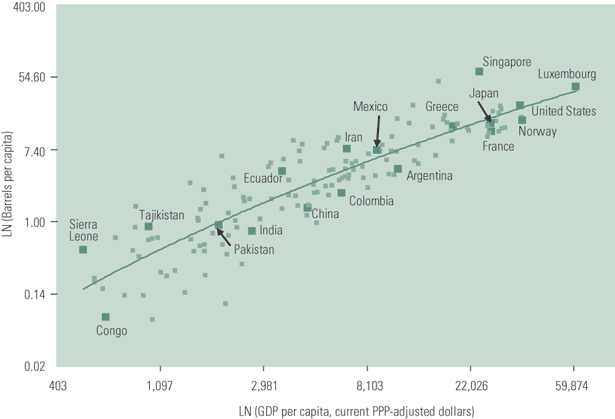
Energy is a strategic raw material for modern economies. As we can see in Figure 1, there is a definite relationship between a country's gross demographic product (GDP) per capita and its energy consumption per capita4, as rising energy consumption correlates to increasing GDP. A simple lesson for governments: make more energy available and the economy will grow. Up to 5 barrels equivalent of per capita energy consumption, economies appear to operate at about 150 GDP$/barrel equivalent. Above 5 barrels equivalent, economies become more efficient and produce 20% more GDP$ per barrel. There is a greater sensitivity in these "efficient" economies to the availability of energy and shortages or price shocks will have a greater impact on their wellbeing.
|
Figure 1. Empirical relationship between countries' GDP per capita
and their consumption of energy in barrels of oil equivalent per
capita.
Source: Steven Brown, Dallas Federal Reserve
|
When the world economy grows faster than the combined rate of inflation and workforce growth, as has occurred since 2000, a number of large countries must be achieving significant growth in GDP$ per capita. Therefore, we should expect increased energy consumption in those countries. Certainly the aggregate demand for energy has shown a dramatic rise during this period. Reassuringly, the GDP output per barrel consumed should also gradually increase as these growing economies more fully transition from agrarian to industrial.
For a world economy whose size is constant in real terms, we can easily identify the countries which are the most sensitive to energy security issues. They are on the right hand side of Figure 1. But since the world economy is growing, we must also look to include those countries that are moving upward to the right on the energy versus GDP curve. These are the BRICs and some countries in Latin America.
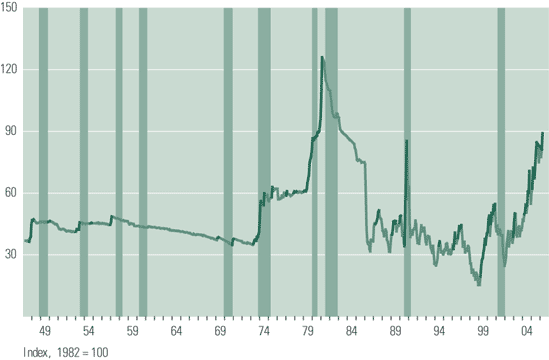
If the energy supply growth rate cannot match the GDP growth rate, the competition will become heated, prices will rise and economies will suffer. Using oil price as a proxy for energy availability, Figure 2 illustrates the effect of supply shortages on the US economy since World War II. In every case of a supply shock, the economy fell into recession within the year.
|
Figure 2. A historical comparison of oil price time series with the
occurrence of economic recessions in the US since 1947. Oil price
referenced to 1982. Recessions indicated by vertical bars.
Sources: Platts and US Federal Reserve
|
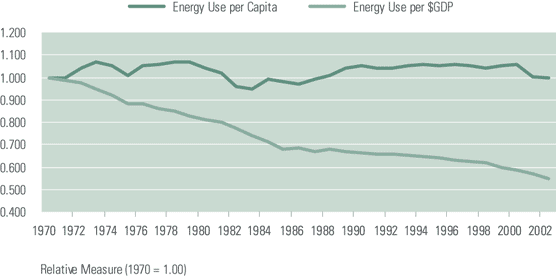
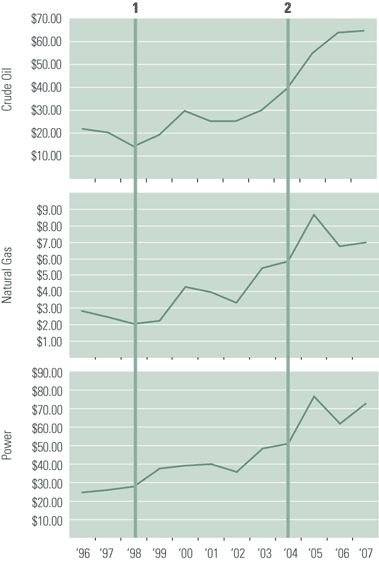
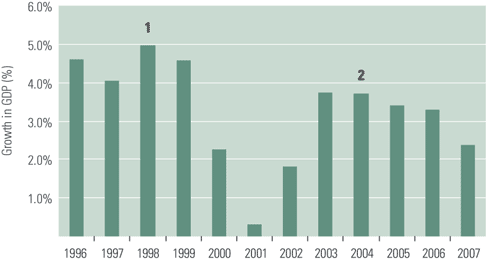
Beginning in 1973, oil price changes were no longer limited to shocks. Prices occasionally experienced a jump to a new equilibrium price. When the shock was in actuality a jump to a higher equilibrium price, the economy took longer to recover. Figure 3 shows that the US economy recovers by reducing its energy consumption per GDP dollar. However, even after 20 years of nearly continuous efficiency gains, the US economy still reacts to price shocks. Figures 4a and 4b illustrate the post-2000 price shock impact on GDP quarterly growth for three energy constituents (crude oil, natural gas, and power).
|
Figure 3. The United States economy's response to oil price shocks
in 1973, 1979 and 1981-83 has been to improve energy efficiencies.
Through the relative price quiescence between 1986 and 2000, the
economy continued to gain in energy efficiency while maintaining a
near constant use per GDP.
Source: US Energy Information Administration
|
|
Figure 4a. Average annual prices for energy commodities (Brent crude
oil, Henry Hub natural gas, and PJM West power) from 1996 to 2007.
The figures illustrate the cross-commodity correlations between oil
and gas as well as between gas and power. Vertical line 1 indicates
the initiation of a jump in oil price. Vertical line 2 indicates the
initiation of a jump in natural gas price.
Source: Platts Energy Advantage
|
|
Figure 4b. Price jumps continue to negatively impact the United
States GDP growth rate as illustrated by two events since 1998
involving crude oil (1) and natural gas (2) which propagated into
power.
Source: US Federal Reserve
|
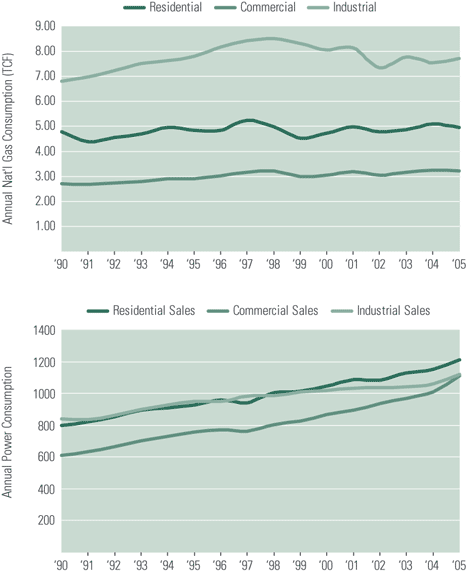
The magnitude of the economy's response is a combination of the economy's dependency on energy and the availability of alternative fuels. Comparing the two events highlighted in Figure 4b, ignoring any non-energy contributions to the economy's performance, there is clearly a different impact. The crude oil price jump that occurred in 1998 and those that followed resulted in a significant slowing in economic growth. As a transportation fuel, there is no alternative to crude oil. The natural gas price jump that occurred in 2004 resulted in a milder GDP growth rate response. Natural gas is used for heating, power generation and in industrial processes. Coal is an alternative fuel to natural gas for power generation. Figure 5 shows the end-use allocation of natural gas and power since 1990. Residential usage is clearly a function of population. Commercial usage is a measure of commerce and trade. Industrial usage is a measure of productivity. Since 1997, industrial usage of power and natural gas has been flat or declining. This explains why the natural gas price jump in 2004 had a limited impact on GDP growth rate.
|
Figure 5. End-use allocation of natural gas and power, indicating a
decline in industrial usage.
Source: Platts Power Outlook Research Service and Platts Gas Outlook
Research Service
|
One source of the decline in industrial natural gas usage is fertilizer. Natural gas is a primary raw material in its manufacture. As gas prices rose through the 1990s, the domestic fertilizer industry decreased in capacity and met demand by importing from countries with low-cost gas resources. While the reduction of industrial demand for natural gas lessened the impact of a price jump in 2004, the loss of domestic fertilizer industry capacity reduced the GDP and added to a trade imbalance.
The Competition
Global competition for natural resources access was historically limited to multinational oil and gas and mining companies, like the US Seven Sisters, Royal Dutch/Shell, British Petroleum and Total in oil and gas and Rio Tinto in mining. Even though these companies were originally focused on their home countries' resource development and energy needs, they developed upstream and downstream operations around the world. The linkage to their home governments' energy ministries and diplomatic corps were, and remain, arm's length, and occasionally they found themselves at odds with foreign policy.
National oil companies, like Statoil (Norway) and Reliance (India), stayed within their home nations' borders. But beginning in the early 1990s, these companies began to look outside for opportunities. They have become very successful in gaining access to oil and gas resources and exploration opportunities.
After the collapse of the Soviet Union, several large companies formed and immediately began competing outside Russia's border, particularly in the FSU countries surrounding the Caspian Sea and in countries previously aligned with the Soviet Union. Following the accession of President Vladimir Putin, Russia re-exerted its sovereignty over foreign ownership of natural resources and has slowly forced percentage ownership changes within joint ventures or even their outright dissolution.
By the late 1990s, Chinese oil and gas companies entered the international competition for resource access. Chinese companies were strong competitors in the mid-1990's Venezuelan auction and were quickly recognized as well-financed acquirers of producing properties around the world. Today China has extensive investments in upstream activities around the world, notably in Africa and South America. South Korea's national oil company has recently become an international participant, expressing intent to acquire production rights to fulfill a significant fraction of its national oil import needs.
The international oil and gas competitive landscape changed radically in a short period. National oil companies exerted their sovereign rights to retain greater ownership of development and production operations. The maturing of the US onshore basins and the North Sea coupled with this reduced access to immature basins led to consolidation among the largest multinationals: Exxon and Mobil, Chevron and Texaco, Conoco and Phillips, BP and Atlantic Richfield and Amoco, Total and Fina, to name a few.
National and Regional Competition
There are multiple implications of increased competition for energy access. Countries are aggressively competing to tie up oil reserves and production capacity to sustain their economies using national oil companies as extensions of foreign policy. As we have seen, oil consumption is intimately related to GDP and, therefore, growth, geopolitical influence, and ultimately a national population's well-being.
China's energy needs and energy security efforts are most obvious among the BRIC and developing countries. The OECD International Energy Agency projects China will require 26 million barrels of oil per day by 2030, from 7 million barrels per day in 2006. China has secured supply from Venezuela, Angola, Sudan, and Kazakhstan through investment and workforce integration. China is increasing diplomatic efforts with Middle East countries in order to ensure additional supply security. Russia, historically a cautious neighbor, is increasing deliveries to China and may divert supplies from export to the world market to supply northern China from eastern Siberian fields. Since 2002, the country's thirst for oil seems to have grown beyond the government's control. Pacific Rim countries are well-advised to follow Japan's and South Korea's example of empowering their national oil companies to increase their participation in exploration, development and production around the world.
The empowerment of Gazprom as Russia's gas diplomat to Europe since 2000 has placed the European Union in a precarious position. Beginning in the late 1980s, Western Europe gradually increased its dependency on Russian gas supplies while its continental reserves declined. Ebbing production capacity from the North Sea Southern Gas Basin and offshore Netherlands will further increase that dependency. Southern Europe is now importing gas from North Africa, but Gazprom is a major stakeholder in the trans-Mediterranean pipeline. The winters of 2005 and 2006 found the EU anxiously looking to the east as Baltic countries struggled to meet Gazprom price increases and flow curtailments to debtor countries affected downstream countries in eastern and central Europe. EU countries have responded by building regasification facilities to source liquefied natural gas from the Middle East, North Africa, Nigeria and even Trinidad and Tobago.
Price competition for LNG cargoes in the North Atlantic Basin was periodically an issue in the early part of this decade but could become the norm if existing EU gas supplies become unreliable. North America has come to depend on LNG imports to cover periods of high demand on the East Coast and the US Energy Information Administration forecasts significant increases in imports as domestic supply declines. LNG cargoes will find premium prices and North American prices may not be competitive with an EU experiencing the effects of Russian gas diplomacy. A 2012 scenario analyzed using Platts' natural gas proprietary market simulation model suggests that Henry Hub prices could double if EU demand absorbed all North Atlantic spot LNG cargoes.
Observations
A scenario in which OECD and BRIC countries are in competition for energy security is clearly under way. Sustaining economic growth and maintaining standards of living are already front and center in the actions of several countries. National oil companies, implicitly and explicitly, are being used as diplomatic agents in this scenario. However, the US and Canada do not seem to have agents in this 21st century reincarnation of "The Great Game." They continue to rely on the multinational presence of US and Canadian-based oil and gas companies to ensure supply to offset domestic shortfalls.
1 Organization for Economic Cooperation & Development
2 BRIC: Brazil, Russia, India and China
3 "Facing Harsh Truths about Energy," National Petroleum Council 2007 Report to Energy Secretary Bodman
4 "Energy Prices and US Economic Activity," Stephen Brown, Dallas Federal Reserve
|
