Surpassing expectations: State of the US wind power market
Surpassing even optimistic projections from years past, the US wind industry experienced unprecedented growth in 2007. Mark Bolinger and Ryan Wiser present highlights from the Department of Energy's second Annual Report on US Wind Power Installation, Cost, and Performance Trends - a comprehensive, yet detailed, overview of key developments.
The wind power industry in the US has been growing dramatically in recent years, and the rapid pace of development has made it difficult to keep up with trends in the marketplace. Yet the need for timely, objective information on the wind industry and its progress has never been greater. As Figure 1 shows, the country added roughly 5300 MW of new wind power capacity in 2007 – more than twice the previous record set in 2006 – bringing the cumulative total to more than 16,900 MW. This growth translates into roughly US$9 billion (real 2007 dollars) invested in wind project installation in 2007. No other country, in any single year, has added the volume of wind capacity that was added to the US electrical grid in 2007.

Figure 1. Annual and cumulative growth in US wind power capacity
Furthermore, for the third straight year, the United States led the world in wind capacity additions, capturing roughly 27% of the worldwide market. In cumulative terms, the US ended the year with 18% of worldwide capacity, in second place behind Germany, see Table 1. So far this decade, cumulative wind power capacity has grown an average of 27% per year in the United States, equivalent to the same 27% growth rate in worldwide capacity.

As both Table 2 and Figure 2 detail, within the United States, new large-scale wind turbine projects were installed in 18 states in 2007; ten of which added more than 100 MW each. After surpassing California in 2006, Texas dominated 2007 in terms of new capacity, with more than 1708 MW installed over the year. Texas continued to build on its cumulative lead, with a total of 4446 MW of wind capacity installed by the end of the year. In fact, Texas alone already has more installed wind capacity than all but five countries worldwide.
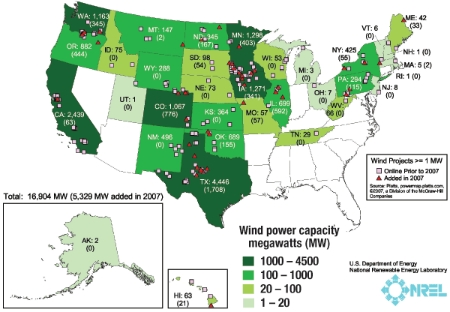
Figure 2. Location of wind power development in the
United States. Source: installed capacity data are from the awea
project database. locations are based on matching the database with platts
powermap data, the physical description in the database and other
available data sources

Interestingly, the average size of installed wind projects has grown substantially in recent years. Projects installed in the US in 2007 averaged nearly 120 MW, roughly double that seen in the 2004–2005 period and nearly quadruple that seen over 1998–1999. These larger project sizes reflect an increasingly mature energy source that is beginning to penetrate into the domestic electricity market in a significant way.
Becoming a significant contributor
Several countries are beginning to achieve relatively high levels of wind power penetration in their electricity grids. Focusing only on the 20 countries with the most installed wind capacity, Figure 3 (page 126) shows that by the end of 2007, installed wind is projected to supply roughly 20% of Denmark’s electricity demand (somewhat less than last year), 12% of Spain’s (up by 2.2% from last year), 9% of Portugal’s (up by 1.6%), 8% of Ireland’s (up by 0.4%), and 7% of Germany’s (also up by 0.4%). In contrast, the cumulative wind capacity installed in the United States at the end of 2007 would, in an average year, be able to supply just 1.2% of the nation’s electricity consumption (up by 0.4% from last year) – the same as wind’s estimated contribution to electricity consumption on a worldwide basis.
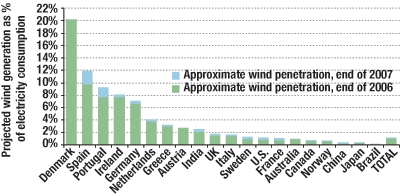
Figure 3. Approximate wind power penetration in the 20 countries with the most installed wind capacity. Source: Berkeley Lab estimates based on data from BTM Consult and elsewhere
However, within the US some individual states are beginning to realize relatively high levels of wind penetration. Minnesota and Iowa lead the nation in terms of estimated wind power as a percentage of total in-state generation, at 7.5% each (Table 2, above). Four additional states – Colorado, South Dakota, Oregon, and New Mexico – surpass the 4% mark by this metric. Though not shown in Table 2, some individual utilities are achieving even higher levels of wind penetration – greater than 10% in some cases – into their individual electricity distribution systems.
Wind has also made great strides in terms of becoming a significant contributor to the nation’s resource mix. For the third consecutive year, wind power was the second-largest new resource added to the US electrical grid in terms of nameplate capacity, behind the 7500 MW of new natural gas plants, but ahead of the 1400 MW of new coal. New wind plants contributed roughly 35% of the new nameplate capacity added to the US electrical grid in 2007, compared to 19% in 2006, 12% in 2005, and less than 4% from 2000 through 2004, as shown in Figure 4, above. Based on the amount of wind power capacity currently working its way through eleven of the major transmission interconnection queues across the country, this trend is expected to continue (see Figure 5). At the end of 2007, there were 225 GW of wind power capacity within these interconnection queues – more than 13 times the installed wind capacity in the US. Moreover, this wind capacity represents roughly half of all generating capacity within these queues at that time, and is twice as much capacity as the next largest resource in these queues (natural gas). Although many of these planned projects are still early in the development process, and a large number are unlikely to achieve commercial operations any time soon (if ever), the 225 GW figure is nevertheless astounding, and indicates the increasingly important role that wind may play in the nation’s power mix.
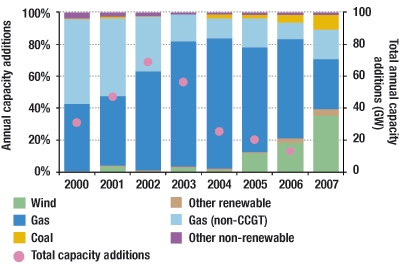
Figure 4. Relative contribution of generation types in annual capacity additions. Source: EIA, Ventyx, AWEA, IREC, Berkeley Lab

Figure 5. Nameplate resource capacity in eleven major interconnection queues
Trends among turbines and their vendors
The average size of the wind turbines installed in the United States in 2007 increased to roughly 1.65 MW, from 1.60 MW in 2006 (see Figure 6). Since 1998–1999, average turbine size has increased by 130%. The distribution of turbine size has also shifted over time; 40% of all turbines installed in 2007 had a nameplate capacity in excess of 1.5 MW, compared to 34% in 2006, 24% in 2004–2005, and 13% in 2002–2003.
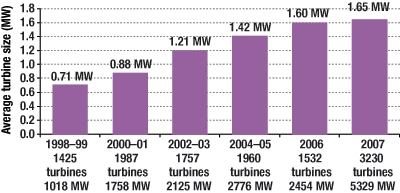
Figure 6. Average turbine size installed during period
GE Wind remained the dominant manufacturer of wind turbines supplying the US market in 2007, with 44% of domestic turbine installations (in MW terms), down from 47% in 2006 and 60% in 2005. The other two market leaders, Vestas (18%) and Siemens (16%), also lost market share in 2007, while Gamesa increased its market share from 2% in both 2005 and 2006 to 11% in 2007 (see Figure 7, page 128). Of course, in a rapidly growing market, percentage market share can be misleading: every turbine vendor active in the US market saw installations of its turbines grow between 2006 and 2007, in many cases dramatically.
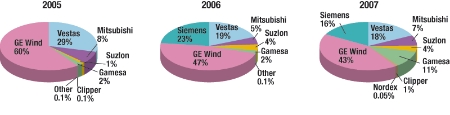
Figure 7. Annual US market share of wind manufacturers by MW, 2005–2007. Source: AWEA project database
As domestic demand for wind turbines continues to surge, a growing number of foreign turbine and component manufacturers have begun to localize operations in the United States. Manufacturing by US-based companies is also starting to expand.
Among the list of wind turbine and component manufacturing facilities opened or announced in 2007 are three owned by major international turbine manufacturers: Vestas (blades in Colorado), Acciona (turbine assembly in Iowa), and Siemens (blades in Iowa). These plants are in addition to facilities recently opened by several other international turbine manufacturers in previous years, including: Gamesa (blades, towers, and nacelle assembly in Pennsylvania), Suzlon (blades and nose cones in Minnesota), and Mitsubishi (gearboxes in Florida). More recently, in 2008, Fuhrländer announced its decision to build a turbine assembly plant in Montana, Vestas announced it would open an R&D centre in Texas, and Siemens announced an R&D centre in Colorado.
Among US-based wind turbine manufacturers, GE maintains a significant domestic turbine manufacturing presence. Meanwhile three newer US-based turbine manufacturers continue to scale up their activities.
Clipper Windpower is in the process of significant expansion, with 137 of its 2.5 MW Liberty turbines produced in 2007, up from eight in 2006. Clipper expects to produce over 300 turbines in 2008 at its Iowa manufacturing facility, and cumulative firm turbine orders equaled 825 machines at the end of January 2008.
CTC/DeWind commissioned its first 2 MW D8.2 turbine in the United States in March 2008. CTC acquired DeWind in 2006, and turbine production commenced in December 2007 at a TECO Westinghouse manufacturing facility in Texas, with an initial capacity of 400 turbines per year and an order backlog of $140 million by the end of January 2008.
Nordic Windpower, a manufacturer of two-bladed turbines, announced that Goldman Sachs made a significant investment in the company in 2007. Nordic subsequently announced the opening of its North American headquarters in California, and in early 2008 announced the location of a planned manufacturing facility in Idaho.
Trends for developers, owners and off-takers
Consolidation in the development end of the wind business continued the strong trend that began in 2005, and that has been motivated, in part, by the increased globalization of the wind sector and the need for capital to manage wind turbine supply constraints. At least 11 significant developer acquisition and investment transactions involving roughly 37 GW of wind project ‘pipeline’ were announced in 2007, consistent with 2006 acquisition and investment activity of 12 transactions with a total 34 GW in the pipeline.
Particularly striking in recent years has been the entrance of large European energy companies into the development side of the US market. At nearly $4 billion in aggregate, the two largest US developer acquisitions in 2007 were the purchase of Horizon Wind by Energias de Portugal and the acquisition of Airtricity North America by Germany’s E.ON AG.
In terms of project ownership, private independent power producers (IPPs) continued to dominate the wind industry in 2007, owning 83% of all new capacity (Figure 8 pie chart). In a continuation of the trend begun several years ago, however, 16% of total wind additions in 2007 are owned by local electrical utilities, split between investor-owned utilities (IOUs) and publicly owned utilities (POUs) roughly two-to-one. Community wind power projects – defined here as projects using turbines over 50 kW in size and completely or partly owned by towns, schools, commercial customers, or farmers, but excluding publicly owned utilities – constitute the remaining 1% of 2007 projects. Of the cumulative installed wind capacity at the end of 2007, IPPs owned 84%, with utilities contributing 14% and community ownership just 2% (see Figure 8 graph).
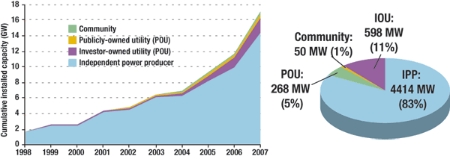
Figure 8. Cumulative and new 2007 wind capacity categorized by owner type. Source: Berkeley Lab estimates based on AWEA project database
Investor-owned utilities continued to be the dominant purchasers of wind power, with 48% of new 2007 capacity and 55% of cumulative capacity selling power to IOUs under long-term contract (shown in Figure 9, above). Publicly owned utilities have also taken an active role, purchasing the output of 17% of new 2007 capacity and 15% of cumulative capacity.

The role of power marketers – defined here as corporate intermediaries that purchase power under contract and then re-sell that power to others, sometimes taking some merchant risk – in the wind power market has increased dramatically since 2000, when such entities first entered the sector. In 2007, power marketers purchased the output of some 20% of new wind power capacity and 17% of the total cumulative US wind capacity.
Increasingly, owners of wind projects are also taking on some merchant risk too, meaning that a portion of their electricity sales revenue is tied to short-term contracted and/or spot market prices (with the resulting price risk commonly hedged over a five to 10-year period via financial transactions).
The owners of 15% of the wind power capacity added in 2007, for example, are accepting some merchant risk, bringing merchant/quasi-merchant ownership to 12% of total cumulative US wind capacity. The majority of this activity exists in Texas and New York – both states in which wholesale spot markets exist, where wind power may be able to compete with these spot prices, and where additional revenue is possible from the sale of renewable energy certificates (RECs).
Increasing cost pressures
Although the wind industry appears to be on solid footing, the weakness of the dollar against other currencies, rising materials costs, a concerted movement towards increased manufacturer profitability, and a shortage of components and turbines continued to put upward pressure on wind turbine costs, wind project costs, and wind power prices over 2007.
Since hitting a nadir of roughly $700/kW in the 2000–2002 period, wind turbine prices appear to have increased by approximately $600/kW (85%), on average (as shown in Figure 10). US wind turbine transactions announced in 2007, for example, had a capacity-weighted average price of $1240/kW.

With turbines accounting for as much as 75%–80% of total project costs, higher turbine prices have unavoidably led to higher installed project costs. Among a sample of 36 wind projects installed in 2007 and totaling 4079 MW (77% of the wind power capacity installed in the US that year), installed costs range from $1240/kW to $2600/kW, with an average cost of $1710/kW (see Figure 11). This average is up $140/kW (9%) from the average cost of installed projects in 2006 ($1570/kW), and up roughly $370/kW (27%) from the average cost of projects installed from 2001–2003.
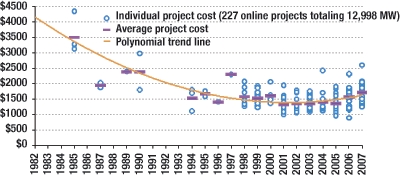
Figure 11. Installed wind project costs over time
Moreover, there is reason to believe that recent increases in turbine costs had not fully worked their way into installed project costs in 2007, and therefore even higher installed costs can be expected in the near future. For example, the average cost estimate for 2950 MW of proposed projects (not shown in Figure 11, but most of which are expected to be built in 2008) is $1920/kW, or $210/kW higher than for projects completed in 2007.
Wind prices rise, but remain competitive
Higher installed project costs inevitably eventually translate into higher wind power prices. Figure 12 shows average wind power sales prices in 2007 for a sizeable sample of US wind projects, grouped by each project’s initial commercial operation date (COD). The general trend exhibited by the capacity-weighted average prices within this sample (shown as the purple columns in the figure) suggests that, following a general decline since 1998, prices for newly built wind projects bottomed out for projects built in 2002 and 2003, and have since risen significantly.

Specifically, the capacity-weighted average 2007 sales price for projects in the sample built in 2007 was roughly $45/MWh (with a range of $30 to $65/MWh, including the value of the Federal production tax credit, or PTC). Although this price is (somewhat surprisingly) slightly less than the average of $48/MWh for the sample of projects built in 2006, it is still higher than the average price of $37/MWh for the sample of projects built in 2004 and 2005, as well as the average price of $32/MWh for the sample of projects built in 2002 and 2003. Moreover, because ongoing turbine price increases have not yet fully worked their way through the development pipeline, prices from projects being built in 2008 and beyond will likely be higher still.
It is important to recognize that wind is not alone in facing increasing cost pressures – other types of power plants have seen similar increases in construction costs in recent years, and fuel prices (natural gas, coal, oil, and uranium) have also increased sharply. In fact, a simple comparison of wind power prices to recent wholesale power prices throughout the US demonstrates that, despite the influence of mounting cost pressures, wind power has remained competitive in wholesale power markets over the past few years.
Specifically, Figure 13 shows the cumulative capacity-weighted average wind power price from our sample in each calendar year from 2003 through 2007, plotted against the range of average nationwide wholesale power prices in each year. Presented this way (which differs from how prices were presented in Figure 12), average wind power prices (which include the value of the Federal PTC) have consistently been at or below the low end of the wholesale power price range since at least 2003.
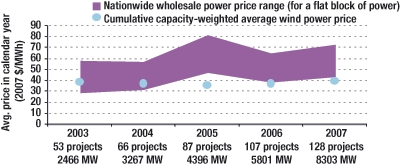
Figure 13. Average cumulative wind and wholesale power prices over time
And 2008 …
Though transmission availability, siting and permitting conflicts, and other barriers remain, 2008 is, by all accounts, expected to be another banner year for the US wind industry. Another year of capacity growth in excess of 5 GW appears to be in the offing, and past installation records may again fall as developers rush to complete projects prior to the scheduled year-end expiration of the PTC. Local manufacturing of turbines and components is also anticipated to continue to grow, as previously announced manufacturing facilities come on line and existing facilities reach capacity and expand.
All of this is likely to occur despite the fact that wind power pricing is projected to continue its upwards climb in the near term, as increases in turbine prices make their way through to wind power purchasers. Supporting continued market expansion, despite unfavourable wind pricing trends, are the rising costs of fossil generation, the mounting possibility of carbon regulation, and the growing chorus of states interested in encouraging wind power through policy measures.
If the PTC is not extended, however, 2009 is likely to be a difficult year of industry retrenchment. The drivers noted above should be able to underpin some wind capacity additions even in the absence of the PTC, and some developers may continue to build under the assumption that the PTC will be extended and apply retroactively. Nonetheless, most developers are expected to ‘wait it out,’ restarting construction activity only once the fate of the PTC is clear.
Mark Bolinger and Ryan Wiser conduct
research on renewable energy economics, markets, and policies at Lawrence
Berkeley National Laboratory.
e-mail: RHWiser@lbl.gov; MABolinger@lbl.gov
The authors’ work on this article was funded by the Wind & Hydropower Technologies Program, Office of Energy Efficiency and Renewable Energy of the US Department of Energy under Contract No. DE-AC02-05CH11231. The Annual Report on U.S. Wind Power Installation, Cost, and Performance Trends: 2007, on which this article is based, is downloadable from http://eetd.lbl.gov/ea/ems/reports/lbnl-275e.pdf
![]() To subscribe or visit go to:
http://www.renewableenergyaccess.com
To subscribe or visit go to:
http://www.renewableenergyaccess.com