* USDA revises its plant hardiness map, bringing climate change down to earth for millions of households across the country.
By Jennifer Weeks
The Daily Climate, March 23, 2009
Straight to the Source
As winter retreats northward across the nation, gardeners are cleaning tools
and turning attention to spring planting. But climate change is adding a new
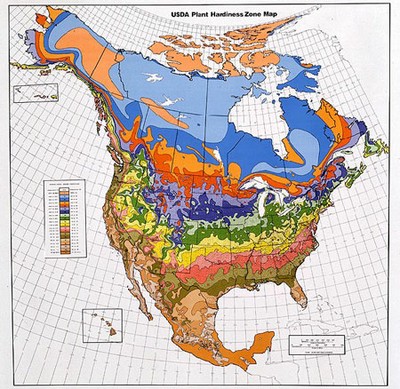
wrinkle, and now a standard reference - the U.S. Department of Agriculture's
Plant Hardiness Zone Map - is about to make very clear how much rising
temperatures have shifted planting zones northward.
The guide, last updated in 1990, shows where various species can be expected
to thrive. A revision is expected sometime this year, and while the agency
hasn't released details, horticulturalists and experts who have helped with
the revision expect the new map to extend plants' northern ranges and paint
a sharp picture of the continent's gradual warming over the past few
decades. The new version will have a wide audience: the National Gardening
Association estimates 82 million U.S. households do some form of gardening,
a number expected to increase as more Americans plant vegetable gardens to
cut food costs.
"Anyone involved with gardening, especially with perennials, uses the map to
pick the right plants for their location," says NGA horticulturist Charlie
Nardozzi. "Shifting hardiness zones are a very tangible result of climate
change, and people will see that change happening where they live over a
short period of time."
Familiar to anyone who has paged through a nursery catalogue, the USDA
hardiness map divides North America into 11 latitudinal zones, each
representing a 10ºF range of "average annual minimum temperature" - the
coldest lows that can be expected in that area. Zones 2 through 10 are each
subdivided into two sections - "a" and "b" - that represent 5ºF ranges. Zone
11 (southern Mexico and much of Hawaii) is tropical, with winter lows above
40ºF.
Reclassifying a gardener's yard into a warmer area opens new options for
planting flowers and shrubs that would probably not have survived local
winters in the 1970s or 1980s. And the visual impact of a map, with
inevitable comparisons to the 1990 version, is likely to make even
non-gardeners ask what it means to live in zone 7 instead of 6.
By injecting climate change into one of America's favorite pastimes, the
revised USDA map could become an important public education tool. "Hopefully
the new map will clear up a lot of confusion about what's happening to the
climate," said Nardozzi.
USDA climate zones are based on measurements from the Commerce Department’s National Climatic Data Center, plus national sources in Canada and Mexico. Every ten years the data center calculates new U.S. “climate normals,” or 30-year average values, for meteorological elements such as temperature, precipitation, and heating and cooling degree days for thousands of U.S. weather stations.
Station locations change and methods evolve, so the climate data center
warns that comparing normals between different 30-year periods may lead to
“erroneous conclusions” about climate change. Nonetheless, the center
released an image in 2003 showing the difference between average minimum
winter temperatures throughout the United States for 1961-1990 and
1971-2000. In nearly every part of the continental United States winter lows
were warmer during the second period, rising as much as 2.5ºF in parts of
the Rockies, the northern Great Plains, and central and southern California.
USDA is not describing what the new map will show, but outside experts say
that the trend is for zones to shift northward. “Some places have definitely
warmed, although others haven’t changed at all,” says Tony Avent, owner of
North Carolina-based Plant Delights Nursery and an advisor for the revision.
They also describe the new map as much more sophisticated than the 1990
version, which was based on a data set covering only 13 years (1974 through
1986 for the U.S.). The revised map draws on 30 years of data and uses a
complex algorithm to factor in other variables that affect local
temperatures, such as altitude and the presence of water bodies.
“All we could really do earlier was draw a straight line between data
points, but now we’re trying to input a lot of other information,” says USDA
spokeswoman Kim Kaplan. “We’ll pick up more heat islands and cold zones, and
the edges of zones will be defined more clearly.”
| We always try to test the limits. All gardeners are in zone denial.
- Michael Dosmann, Harvard University’s Arnold Arboretum
|
The new map is being developed by Oregon State University’s PRISM Group,
a team of modelers that also produces climate maps for other state and
federal agencies. Unlike past versions, the 2009 map will be GIS-compatible,
storing and linking layers of information in a digital version that can be
read with widely available GIS (geographic information system) viewing
programs. It will have a resolution of 800 square meters, so users will be
able to zoom in on their home towns or zip codes and see where they lie
within zones.
USDA commissioned the revision after a flap in 2003, when the American
Horticultural Society released a draft update based on 16 years of
temperature data. USDA had funded the project but rejected the update, which
was configured differently and showed significant warming over the 1990
version, with many parts of the nation shifted into warmer climate zones.
(The Arbor Day Foundation displays a modified version of the rejected map on
its web site, along with an animation that shows the foundation’s estimate
of warming since 1990.)
Some observers suggested that the Bush administration pulled the map because
it showed the nation warming, but Kaplan calls that idea an urban myth.
“There was no memo from the White House,” she says. “The draft was rejected
because it wasn’t web-friendly and wasn’t layered in a standard GIS format.
The data were never reviewed – formatting and technology issues got it
bounced.”
Both the 1990 map and the aborted 2003 version are unreliable because they
use too little data to show lasting trends, Avent contends. “The first time
they got a cold data set and the second time they got a warm data set,” he
says.
Avent points to Chicago, which lies on zone 5b on the 1990 map but shifted
into zone 6 on the 2003 draft. “In 2004 Chicago had a -21º winter, “Avent
said. “If Chicago gardeners had planted zone 6 plants, they would all have
failed. When plants die customers give up gardening, and that’s the nursery
business’s worst nightmare.”
Michael Dosmann, curator of living collections at Harvard University’s
Arnold Arboretum in Boston and an advisor on the USDA revision, expects that
the new map will be much more credible than either the AHS version or the
current 1990 map. “I think we can have a lot of faith in it. The data set is
very robust, and the modelers have done an amazing job,” says Dosmann.
(Arnold Arboretum horticulturists produced early climate zone maps from the
1930s through the 1960s.) Like Avent, he predicts that the new map will show
“some zone creep, but not the extremes in the Arbor Day map.”
* * *
Although it’s significant when hardiness zones shift, gardening experts
emphasize that they are guidelines, not blueprints. “The map minimizes
people’s odds of planting things that are likely to fail,” says Avent. For
example, calla lilies are hardy in zones 8 to 10, so there’s not much point
in planting them in Minneapolis, which lies in zone 4a..
But there’s no guarantee that a plant rated hardy for zone 4 will
actually thrive in Minnesota backyards. Every garden contains microclimates
that influence what can grow there. Fragile plants may thrive in sunny
protected corners, even if exposed areas of the same yard are ten degrees
(i.e., a full climate zone) colder.
“To help plants succeed, you have to understand how they grow and site them
carefully,” says Dosmann. “Plants can’t read the map, and they don’t always
respect our zones.” Dosmann and his colleagues study the Arnold Arboretum’s
microclimates intensively and try to work with them – for example, by
planting less-hardy plants on warm south-facing slopes.
Once gardeners know what’s possible in their own flower beds, they can start
to push the envelope. Boston lies in zone 6, but the Arboretum constantly
tests species that are adapted to warmer areas, such as some hardy types of
camellias. It does so not in response to climate change but as part of its
mission to keep adding new plants to its collection.
“We always try to test the limits,” says Dosmann. “All gardeners are in zone
denial.”
Jennifer Weeks is a freelance writer based near Boston, Massachusetts.
© Jennifer Weeks. All rights reserved.
Current (1990 version) Plant Hardiness Zone Map courtesy USDA.
Contact Daily Climate editor Douglas Fischer at dfischer@dailyclimate.org
The Daily Climate. 421 Park Street, Suite 4. Charlottesville, VA 22902
To subscribe or visit go to: http://wwwp.dailyclimate.org