Foreclosure Zombies of Mass Destruction
Location: New York
Author:
Ira Artman
Date: Monday, April 20, 2009
THE ZOMBIES ARE COMING
The foreclosure zombies are coming – coming to a neighborhood near … yours.
At first, they were an insignificant speck. You could be forgiven if you stepped over (or on) them when they crossed your path. But the undead gradually infected more and more of the living. Now, they are ready for their furious mass attack. The proof is in the charts.
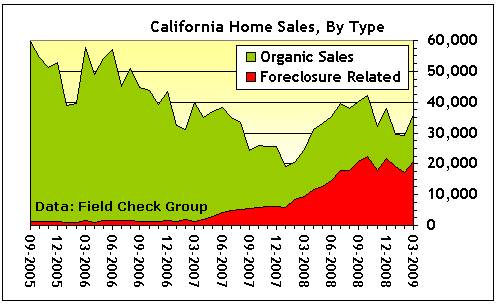
Figure 1: Number of CA Home Sales, Organic & Foreclosure Related
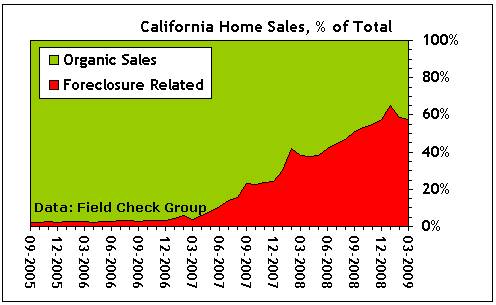
Figure 2: Percent of CA Home Sales, Organic & Foreclosure Related
Figures 1 & 2 are based on ForeclosureRadar.com data from the Field Check Group’s April 16th report, graciously provided by Mark Hanson. The Field Check Group divides California home sales into two groups:
- Organic Sales: From “Ma and Pa Homeowner” – that composed virtually all of the real estate market until 2006; and
- Foreclosure Related: Sales of bank-owned properties, acquired through foreclosure. They are sold, through real estate agents, on the banks’ behalf.
As Figure 2 demonstrates, foreclosures now account for more than half of California home sales, and Mark Hanson observes that this holds true for “most other bubble states.”
Two questions remain:
1. What can stop the foreclosure zombies?
2. What is the cost of their attack?
Qn #1: HOW CAN WE STOP THE ZOMBIES?
Based on prior government policy, the answer to question #1 is easy. All that we need to stop the foreclosure zombies are wishful thinking (foreclosure moratoria) and ineffective modification programs (in which more than half of the “saved” will eventually succumb). See my Jawbone for the details.
Qn #2: HOW MUCH DOES THE ZOMBIE ATTACK COST?
The answer to question #2 - the cost question - is more difficult. Luckily, J. Y. Campbell, S. Giglio, & P. Pathak (of Harvard & MIT) have just released Forced Sales and House Prices: NBER WP 14866 © 2009 – which examines this question.
Their April 2009 paper uses data on Massachusetts’ residential real estate sales over the last 20 years (1987 – 2008) to show that:
- Houses sold, after foreclosure, are sold at lower prices than other houses. Foreclosure discounts are large and average 28% of the value of a house; and
- Foreclosure sales that occur near properties sold in non-foreclosure-related transactions lower the price of the other properties by about 1%.
To see, very roughly, what these findings mean for reported California home prices (IF they applied to the California market), consider the median home prices as reported by the California Association of Realtors® in Figure 3, below.
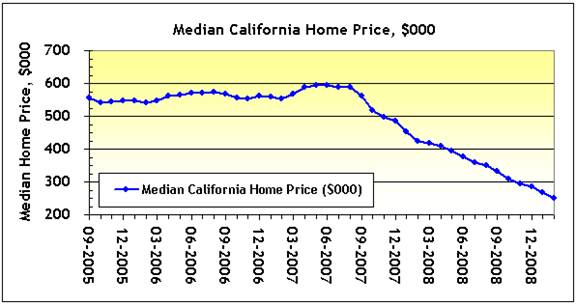
Figure 3: Median California Home Price (Source: California Association of Realtors)
Once adjusted for the a) foreclosure discount, and b) foreclosure proximity discount, I believe that prices would like something like this:
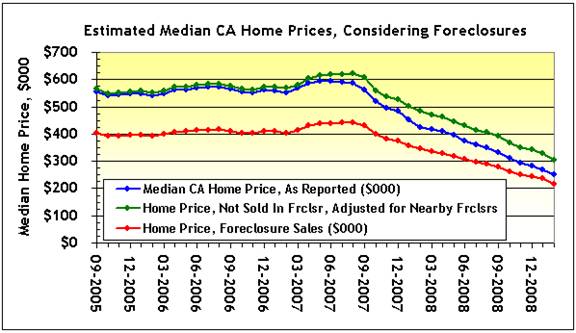
Figure 4: California Home Prices, Reflecting Foreclosure Impact
As indicated, the blue “Median CA Home Price” is the original series as reported by the California Realtors®. The red “Home Price Foreclosure Sales” series reflects the 28% foreclosure discount. Finally, the green “Home Price, Not Sold In Foreclosure” series reflects the price that sellers might have received if they did not reside in foreclosure prone neighborhoods. Also note the following:
- When the CA home sales market had been dominated by organic “Ma and Pa Homeowner” sales (pre 2007), the blue median home price line hugged the green “Home Price Not Sold in Foreclosure” line.
- As the foreclosure zombies grew to command more than half of the market, so did their influence upon the median, and the blue line gradually descended towards the red “Foreclosure Home Price” line.
- At last report, with zombies at about 60% of the market, median prices (at about $250,000) are now $50,000 below the $300,000 “uninfected” no-foreclosure price.
- Finally, Figure 4 pegs the current median sales price of an uninfected zombie-free home at about $300,000. The price of a home captured by foreclosure zombies is about $90,000 less, at about $210,000.
Here’s some advice for my uninfected California readers - you know who you are – the lucky 40%. Lock your doors, guard your homes, and protect your families. The foreclosure zombies are coming. Flee while you can still view the dawn. You have nothing to lose but your equity.
To subscribe or visit go to: http://www.riskcenter.com