Are You Prepared for Another Lost Decade?
Location: New York
Author:
Martin J. Pring, Joe D. Turner, and Thomas J. Kopas
Date: Monday, November 30, 2009
Many investors and members of the financial press are only now recognizing that stock prices have lost ground over the last 10 years, labeling this period as the “Lost Decade”. In April 2003, Pring Turner Capital Group published an article which posed the question: “Whither the Secular Trend of Equities?” This piece laid out our case that the year 2000 was a secular or “long-term” peak for the U.S. stock market. The article also forecast a wide trading range market in the years ahead. Our goal with the forecast in this report is to help you prepare for the next ten years.
Our opinion, based on extensive studies of previous secular bear markets, strongly suggests that investors should anticipate another “Lost Decade”. As we will explain in more detail later in this report, 2009 could mark only the mid-point in this secular bear market. The report will also describe the historic characteristics of long-term secular bear markets and when to anticipate the end of the current secular bear market. Subsequent updates will cover the low-risk money management techniques we have successfully employed in growing client portfolios for the last 10 years. Forewarned and armed with this knowledge, you will be better prepared for the investment battle that lies ahead. Now more than ever investors cannot afford to sit back and relax, but should prepare for another “Lost Decade”.
What is A Secular Trend?
First let us define what a secular or long-term trend is and why it
is important for investors to be able to identify it.Our investment
decision-making process is heavily influenced by the sequential rhythm
of the business cycle, which forthe last 150 years has alternated
between expansions and contractions. A secular trend
is formed when a series of business cycles are linked together
establishing long periods of stock market out or under-performance.
These patterns typically last up to 20 years. In order to successfully
protect and grow wealth, investors need to correctly identify which
long-term price trend prevails.That is becausethe secular trend
determines whether investors act primarily to accumulate wealth
(secular bull) or to preserve it (secular bear).
What is the Current Secular Trend?
The 18-year period from 1982 to 2000 embraced the most recent secular bull market. Stocks were grossly over-valued and investors were wildly optimistic with unrealistic expectations at the conclusion of this secular bull. Since 2000, we have embarked on a much different and far less investor-friendly journey, which represents only the first half of a secular bear market. Chart 1 shows U.S. stock prices adjusted for inflation back to 1870. It strongly suggests we are currently in the 4th secular decline since 1900. The prior three secular trends began in the years 1901, 1929, and 1966 respectively, and lasted on average nearly 20 years.

When Will the Current Secular Bear Market End?
With the benefit of over 150 years of financial history, it is possible to establish benchmarks that tell us when valuations have reached pessimistic extremes. These yardsticks are consistent with an end to a secular bear market. There are many viable benchmarks that can be used to identify secular turning points, but we want to introduce two basic measures that support our outlook.
Duration:
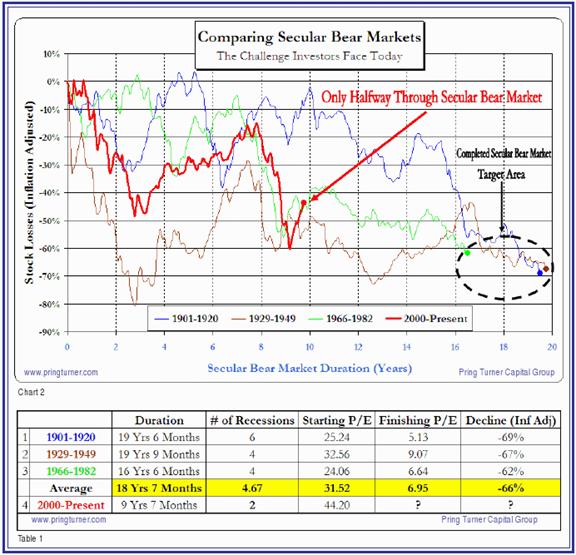
The first benchmark to compare secular bear markets is duration. Chart 2 and Table 1 both show that the last three lasted on average 18 years and 7 months. As of November 2009, the current trend has only lasted 9 years and 7 months, indicating greater potential if it is to even approach the average. As well as being measured in time, duration can also be looked at from the number of business cycles experienced. Prior secular bear markets averaged between 4 and 6 recessions. So far we have only experienced two. Allowing for a best-case scenario of 4 business contractions, this also suggests that we are barely halfway through the current cycle.
Valuation:
Valuation is the second benchmark to use for comparing secular bear markets. Arguably the most popular long-term measure of stock market valuation is the price investors are willing to pay for corporate earnings (Price to Earnings, or P/E Ratio). Why at one time are fearful investors only willing to pay $6.64 for $1 of earnings, (i.e. 1982 Secular Bottom) while at another time investors are eager to pay $44.20 for that same $1 of earnings (i.e. 2000 Secular Peak)? The answer lies in the extremes of confidence or lack thereof only seen at major secular turning points. Take a moment to study the 1Shiller P/E series at the bottom of Chart 1 and the key turning points as summarized in Table 1. Notice at the beginning of secular bear markets, the average P/E ratio is 31.5 (confidence high), in contrast to the average P/E ratios at the end of these periods that are 6.95 (confidence low). The current Shiller P/E reading is 18.77. We may have traveled a long way from the 2000 historic overvaluation peak (P/E 44), but clearly there is a long way to go to reach truly undervalued levels once again.
Based on previous cycles, it is therefore not difficult to conclude that the current secular bear market has further to run in duration (we are only halfway there in terms of years and recessions) and valuation (P/E ratios must return to bargain levels). The combination of duration and inflation-adjusted price declines grind away and erode investor hope. This is why it is not difficult to rationalize any number of economic or geo-political problems, yet to be addressed, that will push us toward the secular bear market bottom.
When will this current secular bear market finally reach bottom? The answer isprobablyin the next 6-10 years when stock prices (adjusted for inflation)finally gravitate towards the target area outlined in Chart 2.
Is it Possible to Build Wealth During a Secular Bear Market?
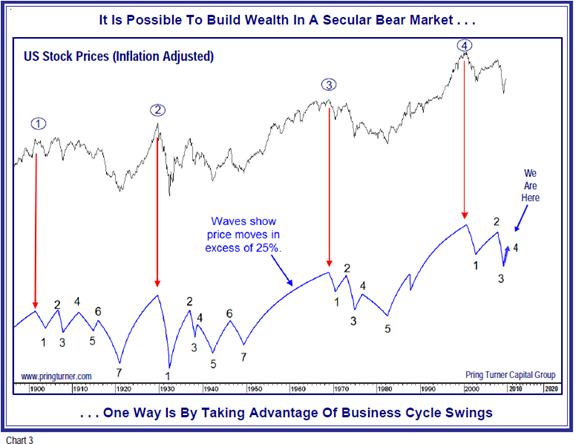
It is possible to build wealth during a secular bear market, but investors must first discard the buy and hold, indexing, and passive asset allocation strategies that worked so well in the prior secular bull market. In a negative secular environment the same static methods result in severely inadequate returns. The crucial determinant to wealth-building success in a secular bear market is to adopt a more pro-active plan of action. Even in this difficult uphill overall negative atmosphere there will be rewarding opportunities. The cyclical bull market that began in March 2009 is a typical example. Others with moves in excess of 25% have been flagged in Chart 3. These primary bull markets reflect the normal transition of a business cycle from economic recession to expansion. The key to the successful exploitation of these moves is the application of the proper business cycle forecasting tools and disciplines.
Why is Business Cycle Analysis More Important Than Ever?
From a business cycle viewpoint it is worth noting that the last secular bull market (1982-2000) covered 18 years but contained only 2 recessions lasting a total of 12 months — that is less than 6% of the time. Compare that to the last ten years in which the secular bear market experienced two recessions lasting a total of 28 months or about 27% of the time. That is far closer to the US experience of the past 150 years where the economy spent an average 31% of the time in recession. If the lessons of previous secular bear markets play out, then the next ten years will experience increased business cycle volatility similar to the 1970’s. Since recoveries will be briefer and contractions more extended, investors will need to be more nimble and opportunistic during bull markets and far more defensive during the longer periods of economic downturn.
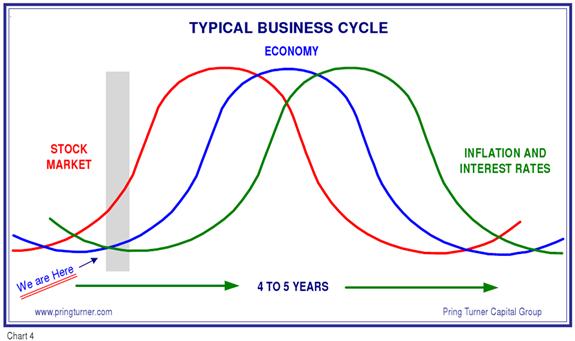
The last 150 years of economic and financial history shows that markets are linked in a logical way to business activity. The economy goes through a set series of chronological sequences just like the seasons of the year. Recognizing these “seasons” and correctly applying the appropriate asset allocation have always had a beneficial impact on investment returns. Chart 4 shows an idealized business cycle and is intended as an investor roadmap that helps drive important tactical asset allocation decisions as the business cycle unfolds.
As to the current business cycle position, Chart 4 shows that the stock market has been advancing for nine months while the economy is just now coming out of a deep recession. For their part, interest rates and inflation are near their lowest levels of the cycle. The shaded area flags where we are today — indicates stocks can be expected to continue to do well as economic growth strengthens, and ultimately interest rates and inflation turn up. Corrections will develop along the way but tactical asset allocation continues to call for stocks to be emphasized in portfolios. As time progresses, bonds will become vulnerable to heightened risks of interest rate increases. A quick business cycle analysis suggests risk of capital loss for bonds is very high. It is important to remember that even a relatively small increase in interest rates will quickly wipe out the paltry income bonds provide at today’s historic low interest rate levels.
Summary
Buy and hold, indexing, and static allocations may work in a secular bull market but they are losing strategies in a secular bear market. In the current environment it is more important than ever to pay attention to the business cycle for financial success. Essentially, an investor needs two game plans, one for defense, to protect assets in difficult periods and one for offense, to grow wealth during favorable conditions. A prudent and profitable investment strategy should be flexible enough to actively adjust portfolio asset allocation, depending on where we are in the business cycle and the direction of the secular trend. With knowledge of business cycles, secular trends, and tactical asset allocation, it is possible to create better returns with less risk and most importantly to experience peace of mind.
Over the next few months we will publish additional articles to expand on the secular outlook and review tactics and strategies to best capture opportunities and build wealth in the difficult period ahead.
Written by: Martin J. Pring, Joe D. Turner, and Thomas J. Kopas of Pring Turner Capital Group
To subscribe or visit go to: http://www.riskcenter.com