Would You Believe $4 Trillion, the Fed Missed the Housing Decline by that Much
Location: New York
Author:
Ira Artman
Date: Tuesday, February 24, 2009
Last week I described how the Fed’s US Flow of Funds “Z1” Release did not recognize that US housing wealth had declined by more than $2 trillion until after the November 2008 Presidential and Congressional elections.
The Fed’s quarterly release first acknowledged this decline on 11 Dec 2008, when it changed the index used to measure home values from:
- The FHFA/OFHEO Home Price Index, reflecting the prices of homes financed by conforming balance mortgages; to
- The LoanPerformance Home Price Index, reflecting the prices of homes financed by conforming, jumbo, and subprime mortgages.
As I described last week, the $2+ trillion figure can be derived simply by comparing the Fed’s Z1 release of 18 Sep 2008 with the release of 11 Dec 2008. If you’re willing to get your hand’s dirty by doing a couple of simple calculations, you will quickly see that the true residential real estate decline is much larger than $2 trillion. It’s more like $4 trillion.
FHFA/OFHEO vs. LoanPerformance vs. S&P Case Shiller National
The more severe decline reflects differences between the two home price indices used by the Fed in the Z1, and a home price index that the Fed has not (yet) publicly used.
I believe, but cannot prove, that differences in the magnitude of the housing value declines produced by the three different indices might account for at least some of 2008’s inadequate policy response. Below is a quick tabular comparison of the three indices.

The Fed used the FHFA/OFHEO index until 18 Sep 2008. As we saw last week (See Did the Fed Miss the Housing Decline?, Figure 3), the Z1 Release using FHFA/OFHEO said that aggregate home values had only declined by $0.731 trillion from the June 2007 peak until June 2008.
Once the Fed replaced FHFA/OFHEO with an index that included non-conforming mortgages from LoanPerformance, the Z1 Release using this index (See Did the Fed Miss the Housing Decline?, Figure 3) said that aggregate home values had declined by $2.233 trillion from the Dec 2006 peak until June 2008.
While the LoanPerformance Index is “better” than the FHFA/OFHEO index, in that it includes conforming and non-conforming loans, it still weights declines by count. This is equivalent to saying that a 10% price decline in a $100,000 home is the same as a 10% decline in a $1,000,000 home.
For purposes of measuring declines in aggregate housing wealth, we need to switch to the S&P Case Shiller National Index, which is a market value weighted index that includes prices of homes financed by conforming and non-conforming loans.
If you do this, you will get something like Figure 2, below.
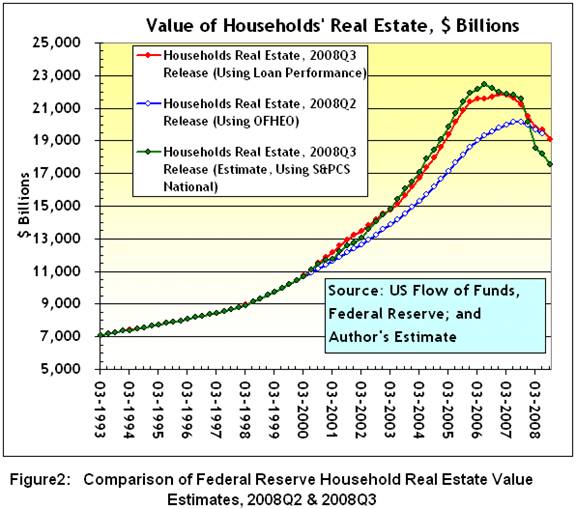
This is similar to last week’s graph, which contained household real estate values released by the Fed in Sep 2008 (blue line), and Dec 2008 (red line). I have now added my estimate (green line) of the path the real estate values would have followed if – after 1999 - the Fed had used a comprehensive market-weighted index, such as the S&P Case Shiller National Home Price Index.
IMPACT OF CHANGE IN HOME PRICE INDEX
As before, I’ve prepared a chart comparing the residential home price value released by the Fed in Sep 2008 (using FHFA/OFHEO) with what (I think) they would have released had they used the S&P Case Shiller National Index. It appears in Figure 3, below.
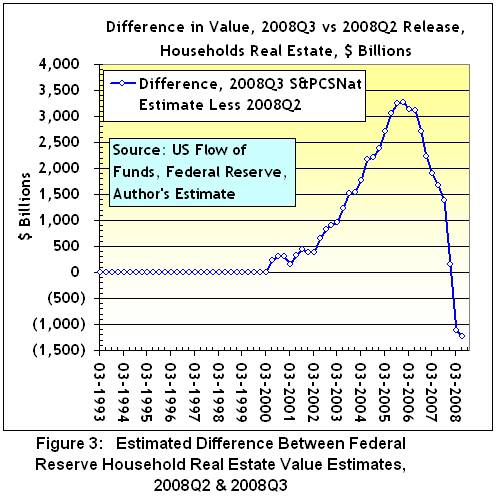
As the chart suggests, had the Fed used the S&P Case Shiller National Index in the Z1 Release, they would have recognized a $4 trillion decline in households’ residential real estate values.
Finally, to see how different the housing bust looks, depending upon which Fed release you use, consider Figure 4, below.
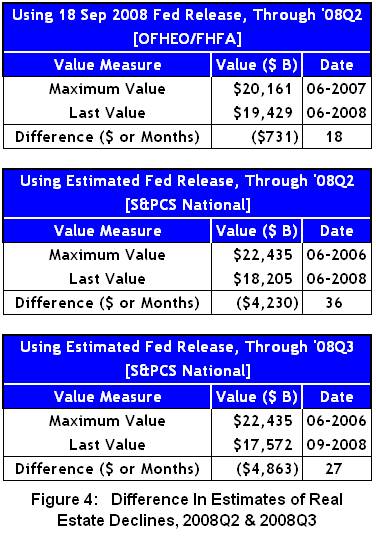
As of the Sep 2008 release, the Fed’s Z1 only recognized a $0.731 trillion residential real estate decline, through June 2008.
If, however, the Fed had used the market-weighted S&P Case Shiller National Index in the Z1 Release, I estimate that they would have recognized a decline in house real estate value that exceeded $4 trillion.
THIS WEEK’S UNANSWERED QUESTIONS – When Will The Fed Get Smart?
- Since many lenders are smart enough to use market values when they assess their residential real estate assets (at least internally), might this $4 trillion discrepancy between current market values and the Fed’s 2008Q2 account for banks’ reluctance to lend? Banks might have realized, before it was reflected in the Fed’s own releases, the precariousness of the banks’ own positions.
- Will the Fed ever switch from the recently adopted LoanPerformance index to a market value index, such as the S&P Case Shiller National Index, in the Z1 Release? Has it done so already - internally - but is it reluctant to publicize the result, due to the implications this would have for bank equity and solvency?
- How many election cycles must we wait before the Fed makes this switch?
I still can’t say.
REFERENCES
Federal Reserve, Flow of Funds Table B 100, Page 102 & Data Downloads- 2008Q2 on 18 Sep 2008, and 2008Q3, on 11 December 2008.

To subscribe or visit go to: http://www.riskcenter.com