| 1.15.09 | Michael Ferrari, VP Technology, WTI |
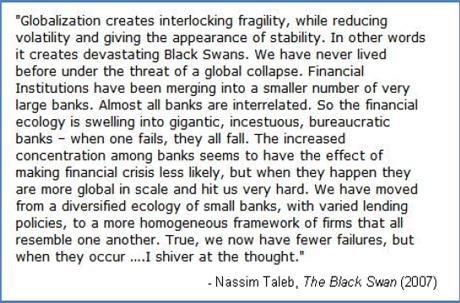
While the idea has been the central thesis of many of Nassim Taleb's writings over the last several years, the publication of TheBlackSwan1 could not be more timely. Further, the more we look around us, the more we see Black Swans in today's global commercial and financial complex, as well as in the world at large. Many readers in the commodities sector are no doubt familiar with Taleb's popularization of Black Swans. For those who are not, the premise goes back to the formerly accepted Euro-centric idea that all swans are white. That is until the Europeans first traveled to Australia and discovered this was not the case. Contemporary economics, short-term thinking, and the need to quantify and compartmentalize our ideas in order to make sense of them, all serve to remove the 'gray area' from our sense of reasoning; unfortunately, the gray area is the source material from where the highest potential for discovery lies. Saying all swans are white was correct, until the first documentation of a black-colored species. Previous models become useless, and the world view changes in an instant. Extending this to other areas of contemporary markets, most of the major financial risks were assumed to be properly hedged, until the recent collapse of the banking system. Weather has these Black Swans too. It follows that blindly assuming continued warming climate trends will lead to the observation of slightly warmer temperatures year over year may work for a while, until a cold snap like the one that hit the eastern US at the beginning of last winter produces one of the coldest starts to winter in many years. This is the example that will be discussed in this brief paper.
Observations show that the globally averaged surface air temperature has
increased +0.6*C +/-0.2*C, over the last 100 years2. This is documented
through a careful analysis of the surface temperature recordings obtained
from tens of thousands of locations around the world. But what does a
globally averaged increase in surface temperature really mean? As it turns
out, not very much. An increasing linear trend is, just that: a line drawn
through a series of data points. Most of the data points will fall somewhere
in the vicinity of the trend line. Some, those within one standard
deviation, will be slightly above the trend line, while others will be
slightly below. These cases will still be considered by most to be part of
the normal distribution. Other data points, fewer in number, will be found
further above and below the trend line; these, depending on location and
time of year that the observation took place, may raise some eyebrows, but
will still be included in them. Finally, we get to what statisticians love
to describe as the outliers; those data points that are well outside of the
distribution, and therefore conveniently 'ignored'.
With climatological analysis, there will always be extreme cases that will
be recorded and will appear well outside of the majority of the histogram.
Ignoring these data points, however, is the absolute last thing a careful
observational scientist should do. The most interesting answers are usually
found in the tails. When we are trying to understand the physical mechanisms
that lead to these values, it is plain foolishness to smooth the data,
minimizing peaks and troughs, and in the process diminishing the importance
of these outliers; doing this masks the opportunity to learn something new
about climate behavior.
A few examples follow. The 1993 floods in the Midwest were a once in a
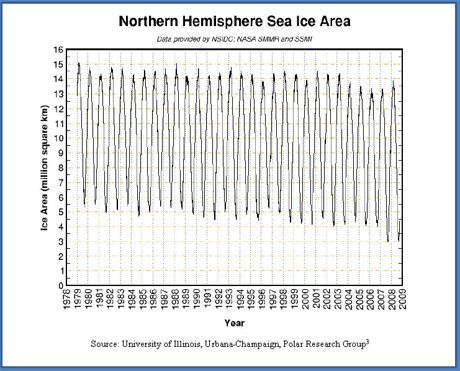
lifetime weather event; that is until the spring of 2008. Ice cover for the
Northern Hemisphere has been steadily decreasing3, which has been more
pronounced since the early 1990s; that is until the winter of 2007/08 saw
the largest build in ice cover over the last 30 years.
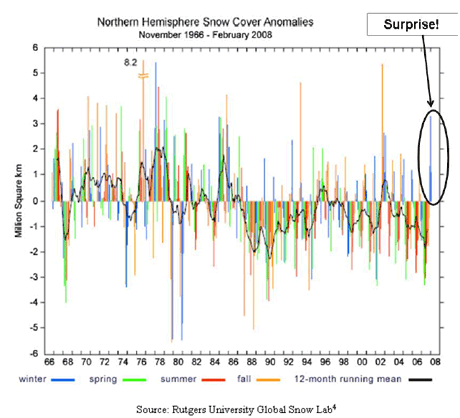
Here is another similar example with snow cover. The areal extent of Northern Hemisphere snow cover has been reduced since around 20014, but every once in a while, nature evens things out and shows a build, even in the midst of a broader warming trend.
If we assume trend line climatology, we might get away with being right
by extending a line via regression for a few consecutive years, or even
decades. But when the pattern changes for reasons that are unexpected, we
are not usually prepared to react. This can be viewed as a risk, but a
proper and proactive risk management strategy may be able to use these
events as opportunities.
Regardless of the causes of climate change, one factor is not subject for
debate: year over year global climatic variability is getting more
unpredictable and more extreme. Speculating on these extremes (via directly
in weather futures, or indirectly in the energy and agricultural futures
space) may be dangerous, but disregarding them as unlikely events can lead
to financial disaster.
A simple yet very clear example can be described by arecent weather event
that influenced the US energy market, and this scenario should be relevant
to many readers. The figure below displays November Heating Degree Day (HDD)
values for New York City, between 1992 and 2007. HDDs are a measure of
heating energy demand, and are calculated as a deviation of the average
temperature below 65*F. For example, if the average daily temperature on
November 1st was 60*F, the HDDs for that day would be five. If the average
daily temperature on November 2nd was 55*F, then the HDDs for that day would
be 10, and the cumulative November HDDs would be 15. Therefore, the lower
the average temperature, the higher the HDD value (cooling degree days, or
CDDs, work in a similar fashion with respect to temperatures above 65*F).
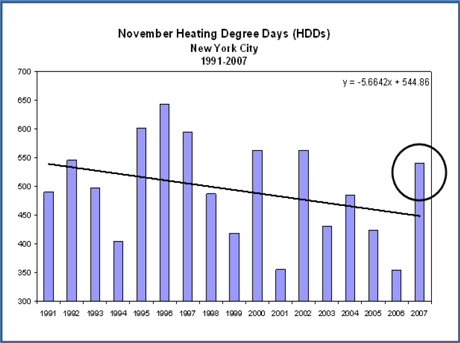
Now even though the temperature trend for New York since the early 1990s has been warmer, a closer look reveals a cyclical heating demand pattern. While it can not be modeled precisely, every few years, a cold November in the east bucks the trend of early warm winters, and this leads to spikes in HDD (as well as energy futures) which are much higher than what was seen during the winter transition of the previous year (eg., 1992, 1995, 2000, 2002, 2004 and 2007).
Not anticipating these spikes can blindside the energy market. Many energy analysts and risk managers do one of two things when setting upcoming seasonal energy demand estimates: (1)they look at the broader trend and extend their projections, or (2)they plan demand requirements off of last year's observations. Both approaches are dangerous, and can lead to losses when an 'unexpected' weather event materializes.
A demand manager who may have used either of these approaches entering into the 2007/08 winter would have been wrong, and depending on how well they were hedged (if at all), a look at the change in energy futures over the subsequent months highlights the magnitude of financial risk. As a quick analysis of the last 17 years demonstrates, these pattern changing events occur at somewhat regular intervals, and anticipating these changes can make the difference between staggering losses for buyers forced to purchase at spot market prices, and healthy gains resulting from early strategic pricing or long term weather hedging.
The figure below highlights this danger of following the trend from a futures perspective. We are certainly not advocating that the run in energy prices that we have seen over the last year was solely a result of weather, but it should be noted that crude oil and heating oil futures were approximately 30% higher at the end of last winter than they were before the 2007/08 heating season started. The early season demand in the central and eastern US was certainly a constructive factor in supporting these markets during and following the 07/08 heating season.
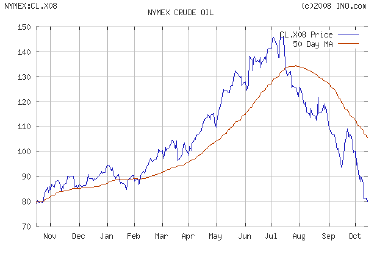
To summarize, regardless of the broader climate trends, nature has a way of correcting herself. The Earth is a complex system, demonstrating properties of balance, emergence, and resilience. Climate does change -- it always has and always will, so even though we may be in a warming period with lower trending winter HDDs, we should not be surprised when we witness a change in the pattern that does not neatly fit an analysis via linear regression. Empirically, these patterns should not be considered Black Swans. But as we all (should) know, the true efficient market is a myth, and subjectivity will always lead to inefficiencies that can be exploited by those who are looking for opportunities via nontraditional analysis.
References: 1 The Black Swan, by Nassim Taleb, 2007. 2 Intergovernmental Panel on Climate Change (IPCC), 2007. 3 University of Illinois, Urbana - Champaign, Polar Research Group 4 Rutgers University Global Snow Lab 5 Ino.com