Generation: Net generation in the United States dropped by 5.0 percent from April 2008 to April 2009. This was the ninth consecutive month that net generation was down compared to the same calendar month in the prior year. The Commerce Department reported that real gross domestic product decreased from the fourth quarter of 2008 to the first quarter of 2009. Continuing to reflect this decline, industrial production in April 2009, as reported by the Federal Reserve, was 12.5 percent lower than it had been in April 2008, the tenth consecutive month that same-month industrial production was lower than it had been in the previous year. The decline in net generation is also consistent with the National Oceanic and Atmospheric Administration’s (NOAA’s) population-weighted Residential Energy Demand Temperature Index (REDTI) for April 2009, which was 2.3 percent “below average consumption.” In April 2008, the REDTI was “near average.”
The drop in coal-fired generation was the largest absolute fuel-specific decline from April 2008 to April 2009 as it fell by 20,551 thousand megawatthours, or 13.9 percent. Declines in Alabama, Georgia, Ohio, North Carolina, West Virginia, Wisconsin, and Texas accounted for 52.3 percent of the national decrease in coal-fired generation. The April decline was the third consecutive month of historically large drops in coal-fired generation from the same month in the prior year, though it was not as precipitous as the drop of 15.3 percent in March or the decline of 15.1 percent in February. The April national level decline was the fourth-largest percentage decrease in generation since 1974. Generation from conventional hydroelectric sources was the largest absolute increase in April 2009 as it was up by 3,918 thousand megawatthours, or 18.4 percent from April 2008. Increases in Washington and Oregon accounted for 67.9 percent of the national rise. Generation at Washington’s Grand Coulee facility, the largest power plant in the United States, was up 35.3 percent. Nuclear generation was up 3.1 percent. Generation from natural gas-fired plants was down by 1.5 percent. Net generation from wind sources was 34.8 percent higher. Higher wind generation totals in Texas, Iowa, New York, and Indiana accounted for 62.2 percent of the national increase. Petroleum liquid-fired generation was down by 26.5 percent compared to a year ago, and its overall share of net generation continued to be quite small compared to coal, nuclear, natural gas-fired, and hydroelectric sources.
|
Figure 1: Net Generation by Major Energy Source: Total (All
Sectors),
May 2008 through April 2009 |
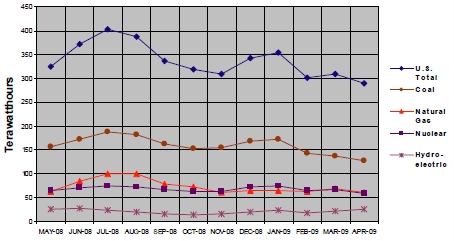 |
Year-to-date, total net generation was down 4.7 percent from 2008 levels. Net generation attributable to coal-fired plants was down 12.2 percent. Nuclear generation was up by 2.3 percent. Generation from petroleum liquids was up by 10.9 percent, while natural gas-fired generation was up by 0.4 percent year-to-date. The 34.8-percent jump in wind generation in April contributed to a year-to-date increase of 34.9 percent.
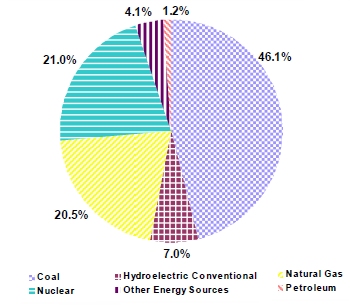
| Figure 2: Net Generation Shares by Energy Source: Total (All
Sectors), Year-to-Date through April, 2009 |
|
Year-to-date, coal-fired plants contributed 46.1 percent of the Nation’s electric power. Nuclear plants contributed 21.0 percent, while 20.5 percent was generated at natural gas-fired plants. Of the 1.2 percent generated by petroleum-fired plants, petroleum liquids represented 0.9 percent, with the remainder from petroleum coke. Conventional hydroelectric power provided 7.0 percent of the total, while other renewables (biomass, geothermal, solar, and wind) and other miscellaneous energy sources generated the remaining 4.1 percent of electric power (Figure 2).
Consumption of Fuels: Consumption of coal for power generation in April 2009 was down by 12.7 percent compared to April 2008. For the same time period, consumption of petroleum liquids was down by 26.9 percent, while petroleum coke increased by 2.5 percent. Consumption of natural gas decreased by 1.5 percent.
Fuel Stocks, Electric Power Sector, April 2009
Total electric power sector coal stocks increased between April 2008 and April 2009 by 34.2 million tons. Stocks of bituminous coal (including coal synfuel) increased by 35.2 percent, or 22.1 million tons between April 2008 and April 2009 (from 62.8 to 85.0 million tons). Subbituminous coal stocks grew by 10.4 million tons between April 2008 and April 2009 (from 87.4 to 97.8 million tons). April 2009 was the ninth month in a row that coal stocks were higher than the same month in the prior year.
Electric power sector liquid petroleum stocks totaled 43.6 million barrels at the end of April 2009, a decrease of 2.7 percent (1.2 million barrels) from April 2008. April 2009 stocks were 1.4 percent (0.6 million barrels) higher than at the end of March 2009.
Fuel Receipts and Costs, All Sectors, April 2009
In April 2009, the prices of coal and natural gas to electricity generators decreased from the previous month, while the cost of petroleum liquids increased. Receipts of petroleum liquids, coal, and natural gas all decreased during the same timeframe.
The average price paid for coal in April 2009 was $2.23 per MMBtu, down 2.6 percent from the price paid in March. It was 12.6 percent higher when compared with the April 2008 price of $1.98 per MMBtu. Receipts of coal in April were 80.3 million tons, down 6.9 percent when compared with March 2009 data and down 8.1 percent from April 2008.
The average price paid for petroleum liquids increased from $8.08 per MMBtu in March 2009 to $9.15 in April. This was a 13.2-percent increase from March and a 38.1-percent decrease from April 2008. Receipts of petroleum liquids in April 2009 were 3.8 million barrels, a decrease of 26.9 percent from March 2009 and a 42.1-percent decrease from April 2008.
The average price paid for natural gas by electricity generators in April was $4.40 per MMBtu, a 6.2-percent decrease from the March 2009 level of $4.69 and a 55.6-percent decrease from April 2008. Receipts of natural gas were 556.2 million Mcf, down 7.8 percent from March 2009 and down 1.1 percent from April 2008.
The overall price paid by electricity generating plants for fossil fuels was $2.85 per MMBtu in April 2009, a 4.4-percent decrease from March 2009 and a 30.8-percent decrease from April 2008. Year-to-date (January through April) 2009 prices compared to the same period last year were up 17.1 percent for coal, down 42.8 percent for petroleum liquids, and down 41.7 percent for natural gas. Year-to-date 2009 receipts compared to the same period last year were down 3.0 percent for coal, up 18.5 percent for petroleum liquids, and down 0.7 percent for natural gas.
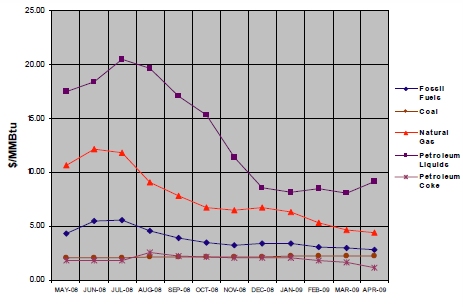
| Figure 3: Electric Power Industry Fuel Costs, May 2008 through April 2009 |
 |
Sales, Revenue, and Average Retail Price, April 2009
The average retail price of electricity for April 2009 was 9.69 cents per kilowatthour (kWh), 0.6 percent lower than March 2009 when the average retail price of electricity was 9.75 cents per kWh, and 4.2 percent higher than April 2008, when the price was 9.30 cents per kWh. Retail sales between April 2008 and April 2009 decreased 4.9 percent. The average price of residential electricity for April 2009 increased 0.57 cents per kWh to 11.59 cents per kWh from April 2008 and was up from 11.38 cents per kWh in March 2009. At 11.59 cents per kWh, the average residential price of electricity increased by 5.2 percent from April 2008.
Sales: For April 2009, sales in the residential and commercial sectors both decreased by 0.7 percent and 1.6 percent, respectively, while sales in the industrial sector decreased by 13.6 percent, as compared to April 2008. For the month, total retail sales were 263.6 billion kWh, a decrease of 18.3 billion kWh from March 2009, and a decrease of 4.9 percent or 13.5 billion kWh from April 2008. Year-to-date 2009, sales were 1,150.0 billion kWh, a 4.2-percent decrease over the same period for 2008.
Revenue: Total retail revenues in April 2009 were $25.5 billion, reflecting a decrease in revenue of 0.9 percent from April 2008, and a 7.1-percent decrease from March 2009. For April 2009, residential sector retail revenues increased 4.4 percent from April 2008, while the commercial and industrial sector retail revenues decreased by 0.3 percent and 11.8 percent, respectively. Year-to-date 2009, revenue increased to $112.2 billion, a 2.9-percent increase over the same period for 2008.
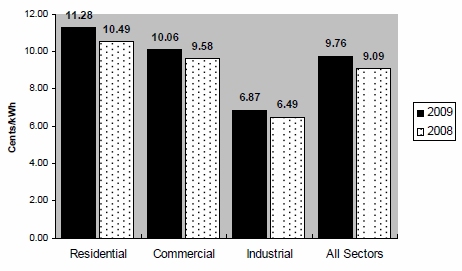
Average Retail Price: For the month, average residential retail prices increased to 11.59 cents per kWh from 11.38 cents per kWh in March 2009, although they were 5.2 percent higher than April 2008 when the price was 11.02 cents per kWh. The April 2009 average commercial retail price was 9.99 cents per kWh, a 1.3-percent increase from April 2008 and down slightly from 10.07 cents per kWh in March 2009. The average industrial retail price for April 2009 rose to 6.78 cents per kWh, a 2.1-percent increase over April 2008 and down slightly from 6.84 cents per kWh in March 2009. Year-to-date 2009, average retail prices increased to 9.76 cents per kWh, a 7.4-percent increase over the same period for 2008 (Figure 4).
| Figure 4: Average Retail Price of Electricity to
Ultimate Customers by End-Use Sector, Year-to-Date through April 2009 and 2008 |
 |
Contacts:
Coordinator -
Generation -
Consumption -
Fuel Stocks -
Fuel Receipts, Cost, and Quality -
Sales, Revenue, and Average Retail Price of Electricity -