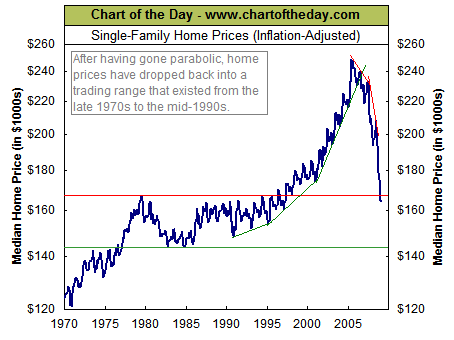
Medium Price of Single Family Home Chart
Location: New York
Author:
chartoftheday.com
Date: Monday, March 30, 2009
For some perspective into the all-important US real estate market, today's chart illustrates the US median price of a single-family home over the past 39 years.
Not only did housing prices increase at a rapid rate from 1991 to 2005, the rate at which housing prices increased – increased.
That brings us to today's chart which illustrates how housing prices have dropped 33% from the 2005 peak.
In fact, a home buyer who bought the median priced single-family home at the 1979 peak has actually seen that home lose value (1.6% loss). Not an impressive performance considering that nearly three decades have passed.
It is worth noting that the median priced home has moved back to the top of a trading range that existed from the late 1970s into the mid-1990s.

Source - National Association of Realtors

To subscribe or visit go to: http://www.riskcenter.com