What Does Dr. Doom Have to Say about US Home Prices?
Location: New York
Author:
Ira Artman
Date: Monday, March 2, 2009
If you missed the Saturday 28 Feb New York Times, then you missed their somewhat tardy recognition of the Irish economist, Morgan Kelly. The Irish call him “Dr. Doom.”
A couple of years ago, when I was developing home price models, I stumbled upon Professor Kelly’s work. I was attempting to construct a home price forecasting model that was a little more plausible than the then-typical “trend in drag.”
Professors Edward Glaeser and Joseph Gyourko (of Harvard and Penn, respectively) had summarized the then-conventional US wisdom regarding home price corrections in their “Housing Dynamics” working paper. They relied upon 1980 – 2005 data.
Looking at regional home prices using FHFA/OFHEO data, they had found that once real (i.e., inflation-adjusted) US home prices reach their peak:
- Real home prices gave back 32% of the increase that occurred in the five years prior to the peak; and
- This real decline takes five years.
While fine, as far as it went, the problem was that data that ended with 2005 could not, in my opinion, have much to say about post-2005 corrections, since the pre-2005 increases were much smaller than the post-2001 boom, which had not yet corrected.
We were living, so to speak, “way out of sample.”
To see this graphically, take a look at the following two charts.
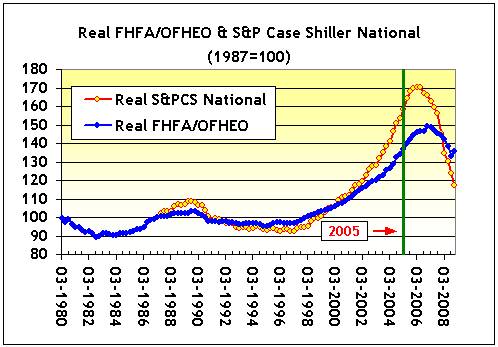
Figure 1: Real FHFA/OFHEO and S&P Case Shiller National Home Prices
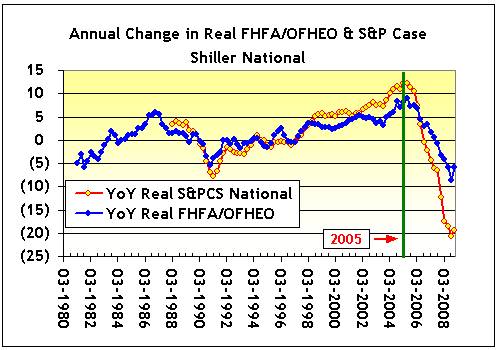
Figure 2: Annual Change in Real FHFA/OFHEO and S&PCS National Home Prices
They depict, respectively, the level and annual changes in each series, where the green line marks 2005, where Professor Glaeser & Gyourko’s FHFA/OFHEO data set ended. While there had been corrections prior to 2005, these corrections were give-backs of increases that were much more modest than the post-2001 boom.
While I was comfortable with the Glaeser-Gyourko metric (i.e., give back of a portion of the increase that occurred 5 years prior to a peak), I was unhappy with the US sample that they had to use.
Where could I find research that worked with increases similar to that of post-2001 America?
And that’s when I discovered Professor Kelly’s On the Likely Extent of Falls in Irish House Prices. Using an international (as opposed to US) data set, Professor Kelly wrote:
- Looking at house price cycles across the OECD since 1970, we find a strong relationship between the size of the initial rise in price and its subsequent fall…
- Economic theory … predicts that house prices should not follow a random walk, but should be a mean-reverting process of booms and crashes around a slowly increasing trend reflecting the growth of household income. This is what the international data show…
- Typically, real house prices give up 70 per cent of what they gained in a boom during the bust that follows. This is a remarkably robust relationship, holding across very different OECD housing markets over more than 30 years.
Needless to say, this dire forecast was a tough sell a couple of years ago – the correction was more than twice as severe as the then-conventional wisdom.
While I managed to use re-expressions of this forecast in models that I constructed of total mortgage market originations (which seemed pessimistic at the time but turned out to be accurate), Dr. Doom’s grim anticipation of a “70% correction” seemed outlandish.
Now, of course, his then apocalyptic view seems quite rosy. Given the flatline trace of household income, we are headed back to what will be a 100% give back. That will bring us back to the real home prices that prevailed in 2001. About fifteen percent lower than today.
REFERENCES
Morgan Kelly, UCD Centre For Economic Research - On the Likely Extent of Falls in Irish House Prices, WP07/01 - Feb 2007.
Landon Thomas Jr., The New York Times - Ireland? Iceland? Doubts on Doomsday Scenario in Eire, 28 Feb 2009.

To subscribe or visit go to: http://www.riskcenter.com