|
In the early nineties, some scientists were saying that carbon dioxide (CO2 ) emissions were causing global warming. This was disturbing to the author; a chemical engineer who has worked on coal conversion processes his whole life. Before it was investigated as to whether or not this was really true, the author developed a scheme to remove CO2 from power plant flue gas by bubbling it through a pond of water to form algae, then skimming it off, drying it and feeding it back to the power plant as a fuel to be blended with the coal. This would do two things, reduce the overall CO2 emissions to the atmosphere, and conserve our coal reserves. After investigating CO2 as a cause of global warming, it appeared at that time to be false.
In the late 1990's it was brought up again and in 2001, the Intergovernmental Panel on Climate Change (IPCC) announced that CO2 was causing the earth to warm and developed computer models to predict how much the earth would warm in the future. In 2006-2007, the author evaluated this again in depth and found the premise was clearly false. IPCC scientists did not relay that, during the time from the mid 1960's to 1998, the stratosphere cooled almost three times as much as the earth warmed. From this input, the author could prove that CFC destruction of ozone, not CO2, was the cause of the abnormal warming over that period. He wrote a paper on his CFC destruction of ozone findings. However, putting this aside, does any evidence exist to support the premise that increased concentrations of CO2 in the atmosphere have caused the earth to warm?
Do Scientists Support Global Warming?
First, most scientists do not agree with the CO2 global warming premise! In the United States 31,478 scientists, including the author, have signed a petition rejecting the Kyoto global warming agreement (see Figure 1) and of these, 9,029 have PhDs, including Dr. Edward Teller.
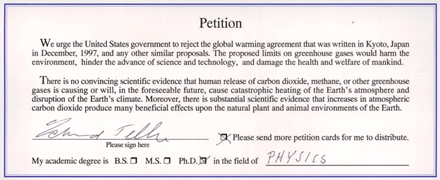
Figure 1. Rejection of Kyoto Global Warming Agreement
1.
In addition, U.S. Senator James Inhofe 2 (R-Okla.), Ranking Member of the Senate Environment and Public Works Committee, recently delivered a global warming speech entitled: "Global Warming Consensus in Freefall: More Than 650 International Scientists Dissent Over Man-Made Global Warming Claims." Inhofe also detailed the growing number of left of center scientists and environmental activists who are speaking out to reject man-made climate fears.
Dr. Richard Lindzen, MIT Professor of Atmospheric Science and past UN IPCC contributor, explained that only a few scientists were involved in writing the IPCC 2001 Third Assessment Report 3. Although purported to speak for thousands of scientists, it was not thousands offering their consensus. Dr. Lindzen participated in that and said, "Each person who was an author wrote one or two pages in conjunction with someone else. They traveled around the world several times a year for several years to write it, and the summary for policymakers had the input of about 13 of the scientists. Ultimately, it was written by representatives of governments, of environmental organizations like the Union of Concerned Scientists, and industrial organizations, each seeking their own benefit."
Gore's "Inconvenient Truth" Documentary has Cause and Effect Reversed
In the documentary "Inconvenient Truth", Al Gore conveniently separated the Vostok Ice core temperature and CO2 graphs so you could not see which came first, a warming spike or a CO2 spike. He said that a CO2 spike came first but alas, it was the just the opposite! When the graphs are combined, it is clearly seen that a global warming spike always comes first (blue line). This warms the oceans, which reduces the solubility of CO2 in water and results in the liberation of CO2 from the oceans. He also gave no explanation what would cause a CO2 spike to occur in the first place. What is so disturbing is that climatologists, like Al Gore, seem to have a problem discerning cause and effect. It is very simple and does not require a rocket scientist. If what you call an effect comes first, you have it backwards; the cause comes first to produce the effect.
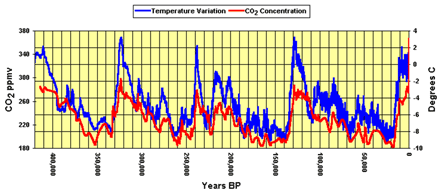
Figure 2. Vostok, Antarctica Ice Core Data 4.
Does Atmospheric CO2 Change Correlate with Earth Temperature Change?
Does a correlation exist between the concentration of CO2 in the atmosphere and the earth's temperature? No, that does not exist. Does an increase in CO2 cause the earth's temperature to increase? No, look at Figure 3 below developed by Joseph D'Aleo, certified meteorologist. Even a non-scientist can see there is absolutely no correlation between CO2 concentration in the atmosphere and the earth's temperature. If there were a correlation, they both would rise and fall together. The CO2 has been on a continuous upward trend -- not true for the earth's temperature.
The atmospheric concentrations of CO2 were taken at the Mauna Loa Observatory in Hawaii. Two sets of temperature measurements are shown, one set by NASA's Microwave Sounding Unit (MSU) for the troposphere and the other by the UK's Hadley Climate Research Unit for the land and sea. Both show declining temperatures over time even as CO2 has increased from 366 ppmv in January 1998 to 385 ppmv by January 2008. Note that the earth surface temperature (pink line) in January 2008 was some 0.48 oC cooler than it was in January 2003.
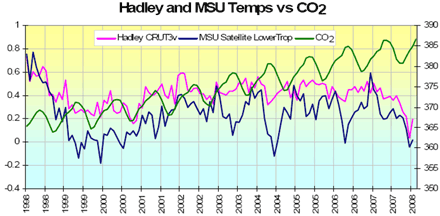
Figure 3. Earth Temperature and Atmospheric CO2 Concentration
5.
Global warming advocates also say that CO2 builds up in the atmosphere over a 50 to 250 year period, but this cannot be true either. Figure 3 above shows that the CO2 concentration oscillates based on the growing season in the Northern Hemisphere. The ratio of land to ocean in the Northern Hemisphere is about 1 to 1.5 and in the Southern Hemisphere is 1 to 4. Therefore, the Northern Hemisphere with much more land mass has a growing season that dominates the Southern Hemisphere growing season with respect to absorption of CO2.
As shown in Figure 3 above, each year around April, increased CO2 absorption by plants in the Northern Hemisphere starts reducing the CO2 in the atmosphere and the reduction continues until around mid to late August when plants start to go dormant. The cycles occur on a regular yearly basis and the swing in CO2 concentration is in the 5 to 8 ppmv range. If CO2 stayed in the atmosphere for long periods before being consumed, the season to season cyclic effect would not be seen. It is clear that nature reacts very fast in its consumption of carbon dioxide.
The graph in Figure 4 shows the IPPC computer modeling projections from the year 2000 to 2100 based on various assumptions of increasing CO2 in the atmosphere. The black line from 1998 to 2008 was added by the author to the IPCC graph; it shows the actual measured surface temperatures.
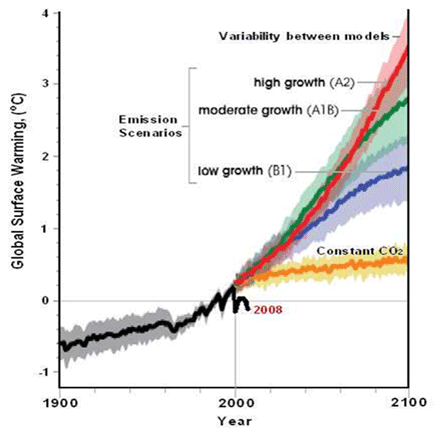
Figure 4. IPPC Predictions compared to Actual Surface Temperature
Measurements 6.
The actual temperature for 2008 was some 0.43 Degrees C cooler than the IPCC projection based on the assumption that atmospheric CO2 concentration remained constant with time. On an actual temperature basis, one sees that the IPCC models predict temperatures that are not even close to actual measurements. The temperature in 2008 was the same as in 1982. To this old chemical engineer, the predictions represent the classic "garbage in -- garbage out" analysis for computer models. It reminds me of the computer models used to predict where Hurricane Ike would hit the U. S. in 2008. Five meteorological models all predicted the hurricane would hit the west coast of Florida, then changed it to New Orleans, then to Galveston, down to Corpus Christy and then back up to Galveston, where it finally hit, all of this over a five day period. Here again, meteorological models are not trustworthy.
Human Made Emissions of Carbon Dioxide (CO2)
Do you realize that CO2 emissions created by man's activities, combustion of fuels, etc. (called Anthropogenic emissions) is miniscule compared to the emissions of CO2 from nature? Table 1 was developed by the IPCC. It shows annual CO2 emissions to the atmosphere from both nature and man and how much of the CO2 emitted is re-absorbed by nature.
| Carbon Dioxide | Natural | Human Made | Total | Absorption |
| Annual Million Metric Tons | 770,000 | 23,100 | 793,100 | 781,400 |
| % of Total | 97.1% | 2.9% | 100% | 98.5% |
TABLE 1. GLOBAL SOURCES AND ABSORPTION OF CO2
Source:
Intergovernmental Panel on Climate Change, Climate Change 2001: The
Scientific Basis
(Cambridge, UK Cambridge University Press, 2001), Figure 3.1, p. 188.
Using the table above in combination with a total concentration of 385 ppmv of CO2 seen in the atmosphere in January 2008, one sees that the increase in CO2 caused by all of man's activities amounted to only 11.5 ppmv. The amount of CO2 from man is a mouse milk quantity compared to nature's emissions. If we eliminated all anthropogenic CO2 emissions, we would go back to the level we had in 2001-2002 when it was warmer than it is now.
Nature absorbs 98.5% of the CO2 that is emitted by nature and man. As CO2 increases in the atmosphere, nature's controlling mechanism causes plant growth to increase via photosynthesis; CO2 is absorbed, and oxygen is liberated. Photosynthesis is an endothermic (cooling) reaction. Further, a doubling of CO2 will increase the photosynthesis rate by 30 to 100%, depending on other environmental conditions such as temperature and available moisture 7. More CO2 is absorbed by the plants due to the increased concentration of CO2 in the atmosphere available for conversion to carbohydrates. Nature therefore has in place a built-in mechanism to regulate the CO2 concentration in the atmosphere that will always completely dwarf man's feeble attempts to regulate it. Further, no regulation by man is necessary because CO2 is not a pollutant; it is part of the animal-plant life cycle. Without it, life would not exist on earth. Increased CO2 in the atmosphere increases plant growth, which is a very good thing during a period of world population growth and an increasing demand for food.
No Greenhouse Signature in Atmosphere
There are several possible causes of global warming, and each warms the atmosphere at different latitudes and altitudes. Each cause will produce a distinct pattern of hot spots in the atmosphere and will leave its "signature". The greenhouse signature is very distinct -- see Figure 5. If this signature were present, warming would be concentrated in a distinct "hot spot" about 8 to 12 km up over the tropics, with less warming further away, turning to cooling above 18 km. Actual measurements have been taken where the warming is occurring using satellites and balloons.
The observed signature is shown in Figure 6. As one can clearly see, the actual signature is nothing like the predicted IPCC "Greenhouse" signature. The greenhouse signature is not seen -- no "hot spot" exists! Although not shown here, the actual signature is most like the one the IPCC developed for ozone depletion.
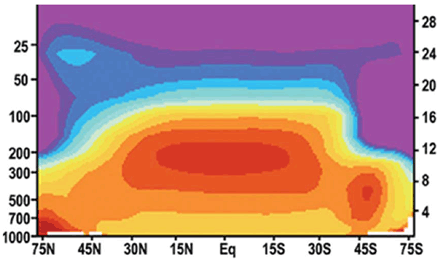
Figure 5. Theoretical Greenhouse Signature (UN climate models)
8.

Figure 6. Actual Observed Signature 9.
IPCC Greenhouse Effect is Impossible
The IPCC (Figure 7) analysis shows 390 watts/m2 being radiated from the earth (right side of graph) to the atmosphere, excluding thermals and water evaporation from plant leaves (evapo-transpiration) for simplicity, when only 168 watts/m2 is absorbed by the earth (left side of graph) in the first place. This graphic violates the first and second laws of thermodynamics, which in essence state that you cannot get more energy out of a system than you put into that system.
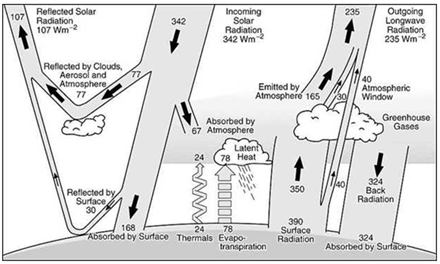
Figure 7. IPCC Greenhouse Effect 10.
If what the IPCC is presenting were true, for every unit of energy in, one would get back (390/168) = 2.32 units of energy. The U.S. Patent Office never awards a patent for a process that claims it gets more energy out than it puts in because thermodynamically it is quite impossible. Strangely, the IPCC promotes such nonsense to the people of the world and is not soundly rebuked for it!
A friend of mine, an analytical chemist 11, correctly writes, "As a further rebuttal of the influence of carbon dioxide over the climate, the alleged IPCC greenhouse effect is a non-existent effect. No greenhouse, whether made from glass, plastic, cardboard or steel will reach a higher inside temperature due to the magic of re-radiated IR energy. If it did, engineers would have long ago been able to design power stations made from air, mirrors and glass, extracting more energy out of it than was put into it -- if only!"
Carbon Tax Effect on the Average American
Taxing carbon would do absolutely nothing to improve the climate but would be a devastating economic hardship to the people in the world. Following is a summary of the U.S. carbon tax legislation 12 proposed by Michigan Representative John Dingell:
Tax on carbon content:
$50 / ton of carbon (phased in over 5 years and then adjusted for inflation)
Let us complete a ballpark analysis of the impact of a carbon tax on the cost of electricity. In the United States, 50% of our electricity comes from coal-fired power plants. According to the U.S. Energy Information Agency (EIA), the average open-market selling price in 2007 was $40.80/ton for bituminous coal (12,500 Btu/lb and 70- wt% carbon). Therefore, the tax on bituminous coal would be around $35/ton (~86% of its open market selling price).
The average selling price of electricity to residential users in 2007 was $0.1061/kWhr. Assuming a heat rate of 10,000 Btu/kWhr of electricity generated for bituminous coal, the carbon tax would add $0.014/kWhr of electricity, a 13% increase.
Tax on gasoline:
$0.50/gallon of gasoline, jet fuel, kerosene (petroleum based), added to current gasoline tax phased in over 5 years and adjusted for inflation. This $0.50/gallon gas tax is in addition to what is derived from the per ton carbon tax in the previous section.
Consider gasoline contains 86-wt % carbon and weighs 6.5 lb/gal. Dingell's carbon tax would add $43/ton of gasoline or $0.14/gallon. When added to the $0.50/gal tax will equate to $0.64/gal. Based on an initial gasoline selling price of $2.00/gallon with the added carbon taxes, the price would increase to $2.64/gal, a 32% increase.
Conclusion
Based on actual data, CO2 causing global warming is clearly a figment of the IPCC's imagination. The lesson to the world here is, when it comes to science, never blindly accept an explanation from a politician or scientists who have turned political for their own private gain. Taxing carbon will have absolutely no beneficial effect on our climate, will hurt the economies of the world, and will be harmful to the production of food because less carbon dioxide means reduced plant growth. Many scientists, including the author, see global warming from CO2 as a cruel global swindle, so that a few, at the expense of the many, can reap huge profits from carbon taxes.
References:
1. Global Warming Petition Project,
Click Here
2.
Click Here
3. Dr. Richard Lindzen, MIT Climate Scientist Calls Fears of Global
Warming 'Silly' - Equates Concerns to Little Kids
Attempting to "Scare Each Other", February 1, 2007 U.S. Senate
Committee on Environment and Public Works,
Click Here
4. Petit, J.R., et. al., "Climate and Atmospheric History of the past
420,000 years from the Vostok Ice Core, Antarctica", Nature 399:
429-436, June 3, 1999.
5. D'Aleo, J. S., "Correlation Last Decade and This Century CO2 and
Global Temperatures Not There"
Click Here
6. NASA Earth Observatory, based on IPCC Fourth Assessment Report
(2007)
(Click
Here) and Hadley Climate Research Unit, Global Temperature Record,
Phil Jones,
Click Here
7. Pearch, R.W. and Bjorkman, O., "Physiological effects", in Lemon,
E.R. (ed.), CO 2 and Plants: The Response of Plants to Rising Levels
of Atmospheric CO2 (Boulder, Colorado: Westview Press, 1983), pp
65-105
8. Intergovernmental Panel on Climate Change (IPCC), 2007, p. 675,
based on Santer et al, 2003. See also IPCC, 2007, Appendix 9C).
9. "Carbon Emissions Don't Cause Global Warming, November 28, 2007",
Dr. David Evans,
Click Here
10. J. T. Kiehl and Kevin E. Trenberth, Earth's Annual Global Mean
Energy Budget, Bulletin of the American Meteorological Society, Vol.
78, No. 2, page 206, February 1997 (adopted by IPCC 2007)
11. Comments to U. S. EPA on Global Warming, Hans Schreuder, November
15, 2008
Click Here
12. Carbon Tax Summary,
Click Here
