How to Compare Power Generation Choices
Understanding a few basic factors will help make an informed
comparison.
by John Hynes, Partner, Excidian
People like to compare the cost to generate electricity from various
renewable resources, like wind or solar, to the cost to generate
electricity from coal, nuclear and natural gas. Comparing these costs is
like comparing apples to oranges. Power generation is a complex business
and without considering load factor; capacity (kW) and energy (kWh); and
fixed and variable costs, these comparisons are not legitimate for
evaluating power generation technologies.
Let’s begin with load factor, or the percentage of hours that a power
plant operates at its maximum capability in a given time period. So if a
1,000 MW nuclear plant has an annual load factor of 98 percent, it is
operating at 1,000 MW for 98 percent of the hours in a year.
Power plants can be categorized by load factor. Base load power plants
typically have annual load factors that exceed 75 percent, but usually
are more like 90 percent to 98 percent. Power plants that fall into this
category can be large (400 MW and larger) fossil fueled plants (coal,
natural gas or–less often–fuel oil) as well as nuclear plants. On the
renewable resource side, geothermal and biomass plants can be placed in
this category. Not many hydro plants in the U. S. fall into this
category unless the dam is large or the flow rate on the river is high
and the weather cooperates.
Intermediate loaded power plants typically have annual load factors
ranging from 40 percent to 60 percent Small (100 MW to 300 MW) coal
plants may operate at these load factors. However, the most common
technology that would operate economically in this load factor category
is the combined cycle combustion turbine, or CCT, fueled by natural gas
with fuel oil as a back up fuel. Most of the hydroelectric plants in the
Western part of the U.S. can operate as intermediate loaded plants,
providing that the weather cooperates, which means that the western
mountain ranges receive an above-average amount of snow during the
winter months. Offshore wind power will also likely operate in this
category. Concentrated solar power, or thermal solar, may break into the
low end (40 percent) of this load factor range as will wave energy
technology (30 percent to 45 percent).
The third load factor category is peak load generation. Power plants in
this category usually operate at very low annual load factors ranging
from 5 percent to 15 percent. This means these types of power plants are
operating at their maximum capability for only 5 percent to 15 percent
of the hours in a year. The most common type of power plant in this
category is the combustion turbine (CT) or simple cycle turbine (SC),
fueled by natural gas with fuel oil as a back up source of fuel. The
next most common type of power plant would be the internal combustion
engine (IC) fueled by natural gas. Renewable resources that would fall
into this category are wind on land, photovoltaic solar, concentrated
solar (thermal solar) and tidal current technology.
For wind on land, the average annual load factor ranges from 20 percent
to 30 percent. Photovoltaic solar has load factors that range from 20
percent to 25 percent. Concentrated solar load factors vary between 25
percent and 40 percent, allowing this resource to linger between a
peaking facility and an intermediate facility. The load factor for tidal
current technology is estimated to average 27 percent.
Now that all of the power generation resources are in an appropriate
load factor category, think of each category as a customer need. Then
think of the types of power generation technologies within a load factor
category as the various products that compete to satisfy that need. This
means it makes no sense to compare the cost per kWh to generate
electricity from wind on land with the costs per kWh to generate
electricity from coal because these two technologies satisfy two
different customer needs; namely, one is a peaking technology, while the
other is a base load technology.
Is there a way to compare technologies from two different load factor
categories? Yes, but one technology would need to be altered to make it
operationally equivalent to the other. In other words, alter one
technology so that both are then in the same load factor category. To do
this for wind on land versus coal, it would be necessary to run the coal
plant as a peaking unit, recalculate all of its costs and compare those
new costs to the wind on land power plant costs. The wind on land power
plant could also be altered to operate base loaded. However, before
trying these more complicated comparisons, it is necessary to understand
the concepts of capacity versus energy.
Capacity versus Energy
To learn how to compare technologies within a load factor category, one
has to understand a number of terms and concepts, like the difference
between capacity — measured in kilowatts (kW) or megawatts (MW) — and
energy, measured in kilowatts-hours (kWh) or megawatt-hours (MWh).
People often quote costs/kW when they are really talking about
costs/kWh. Since these sound similar, they must be similar.
Unfortunately, they are not.
Capacity for a power plant (kW or MW) is probably best explained with a
highway analogy. A 10-lane highway is able to allow more cars to get
from one point to another in a given time period when compared to a
three-lane highway. Likewise, a 1,000 MW power plant has the ability to
put more energy, or MWh, to the grid in a given time period than a 500
MW power plant. The size of the highway is analogous to the capacity, or
MW rating, of the power plant. The number of cars that pass from one
point to another on the highway during a given time period is analogous
to the energy, or MWh, that the power plant delivers during the same
time period.
So the more lanes on the highway, the more cars that can pass from one
point to another in one hour. Therefore, the larger the power plant’s
capacity, the more energy the plant can deliver to the grid in one hour.
Now that we understand the difference between capacity and energy, we
can begin to compare the costs of one power plant to another.
Initial Cost Comparison
The cost to build a power plant, or its capital cost, is usually
discussed in $/kW of capacity. When you hear that the latest estimate
for a brand new nuclear plant is $4,400/kW to $7,700/kW, this means the
cost to build a new 1,000 MW nuclear plant ranges from $4.4 billion
($4,400/kW x 1,000 MW x 1,000 kW/MW) to $7.7 billion ($7,700/kW x 1,000
MW x 1,000 kW/MW).
Note that this has nothing to do with the cost to operate or maintain
the plant. It is just the upfront cost to build the plant. This is a
quick way to compare which technology is the most expensive or least
expensive to build. In general, base load technologies will be more
expensive to build than intermediate load technologies, while
intermediate load technologies will be more expensive to build than
peaking technologies.
Suppose a utility has a 100 MW customer load that needs to be supplied,
but the load is only on the system for three hours a day. The utility
needs to build a power plant to supply this load. What should it choose?
First, determine the load factor. Load factor is: 3 hours/24 hours =
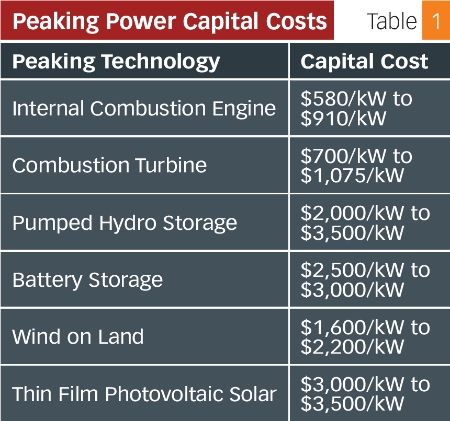
12.5 percent, which calls for a peaking power plant. Next, compare the
cost to build the various competing peaking power generation
technologies. The peaking options are laid out in Table 1 (above).
Perhaps the utility needs to know a little more about this load. At the
very least, the utility needs to answer the following questions:
* Does this load always run for three hours or can its duration vary?
* Does the load come on and go off at the same time each day?
* If “yes” to question # 2, then determine what time of day the load
runs?
Suppose the load duration does not vary (that is, the load turns on and
off at the same time each day) and that time is from 12:00 noon to 3:00
p.m. In this case, whatever technology the utility chooses has to be
capable of providing capacity and energy from 12:00 noon to 3:00 p.m.
each day.
If the utility narrows its choices for peaking options down to the three
least expensive technologies to install, then the concerns related to
those peaking technologies need to be addressed. These concerns are
summarized in Table 2.
After reviewing the options in Table 2, can the utility make a decision?
No. At least four concerns related to these technologies must to be
quantified and compared in a fair manner. Those four are: fuel costs,
pollution costs, operating and maintenance costs and capital costs. The
most objective way to compare these costs across technology choices
within a load factor category is to divide them by the output of the
power plant (kWh), or “per unitize” them.

Variable vs. Fixed Expenses
Before per unitizing these costs, the terms “variable” and “fixed” costs
need to be defined. A variable cost is an expense that varies with
revenue or the volume of sales. Be careful: most people revert to the
dictionary definition of variable and think it means that it is an
expense that varies with time. This is incorrect. In the financial
world, a variable expense varies with revenue or volume.
A fixed expense is an expense that does not vary with revenue or volume.
For every expense, you ask and answer a simple question: “If I produce
and sell one more kWh do I spend more money on this expense?” If the
answer is yes, then it is a variable expense. If the answer is no, then
it is a fixed expense.
Fuel costs are driven not only by the cost of the fuel that is being
converted to electricity, but also by the efficiency of the conversion
process. Fuel costs are truly variable costs. That is, these costs vary
directly with the kilowatt-hours (kWh) generated by the plant. When more
electricity is produced, more fuel is consumed.
Pollution costs are the cost to purchase pollution credits, like NOX and
SO2 credits. These are market based credits that are a function of the
tons of NOX or tons of SO2 that the plant emits. The amount of NOX or
SO2 that the plant emits is directly proportional to fuel consumed,
which is a variable cost. Therefore, pollution credit costs are also
variable costs.
O&M costs, on the other hand, are not generally considered to be
variable costs. The plant staff earns a base wage plus benefits that are
fixed. Overtime for increased production is an extremely small
contribution to variable costs; so small that it is usually disregarded.
Similarly, routine and overhaul maintenance are considered fixed costs.
Incremental plant operation, unless much more than typical, does not
alter the usual maintenance routine and intervals. Finally, many costs
associated with the plant, like insurance and property taxes, are fixed
and change only with variables outside the plant domain. Both of these
costs generally increase yearly with the inflation rate.
Cycling a plant from full output to lower output levels causes an
increase in wear and tear on the plant components. Although the money
spent on labor and material to operate and maintain the plant does not
change at the time the cycling occurs, the increase in wear and tear can
increase the frequency of future maintenance, thus causing an increase
in average O&M costs. Therefore, O&M costs do not usually increase with
each new kWh generated by the plant.
Although this seems like a minor point, it is financially crucial that
individuals making short-term pricing and running decisions for the
plant understand this concept. The financial implication is that
increasing the plant output by 10 percent when it is already running
does not increase the plant’s O&M costs significantly. Therefore, the
generation company can maximize profit by accepting a lower price for
the incremental kWh that the plant generates as long as the price the
company receives covers the plant’s increase in variable costs, which in
this case would be the plant’s increase in fuel costs and pollution
credit costs. In fact, a large portion of the incremental revenue that
the generation company realizes from the 10 percent increase in plant
output will be added right to profit if the plant’s incremental fuel
cost and pollution credit costs per kWh are small in comparison to the
incremental market price the company charges for the additional kWh.
A company experiences capital costs (namely depreciation and financing
costs for plant construction) with the passage of time. Whether the
plant produces one kWh or a million kWhs has no effect on the amount of
depreciation and interest costs the plant incurs. Therefore, capital
costs are also fixed costs. So, fuel and pollution credit costs are
variable costs, while O&M costs and capital costs are fixed costs.
Cost per kWh Comparison
Even though some of the cost categories discussed so far do not vary
directly with the kWh generated by the plant, it is useful from a
competitive analysis point of view to look at all plant costs (fuel,
pollution credit, O&M and capital) on a per kWh basis. This is easy to
do for fuel and pollution credit costs since they do vary directly with
the plant’s kWh output.
For O&M costs, however, take the total amount spent on O&M over a one-
to three-year period and divide that number by the kWh produced during
that time period. This will provide an average O&M cost per kWh.
Obtaining the capital costs in a $/kWh form will require a few
assumptions.
Although equity requirements can be a large percentage of any project
today, for the ease of explanation let’s assume 100 percent project
financing (a form of bank financing). To obtain the capital costs in a
$/kWh form, we must annualize the total cost of the plant and then
divide that annual cost by an estimate of the average annual kWh that
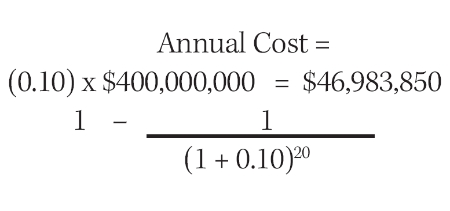
the plant is expected to produce. The following formula is used to
calculate the annual cost of a plant.

Where n = number of years over which the plant is expected to be
financed.
Suppose a series of wind turbines total 200 MW of capacity. Assume these
wind plants cost $2,000/kW to install or $2,000/kW x 200 MW x 1,000
kW/MW = $400,000,000. Assuming an annual cost of financing of 10 percent
(or 0.10) and a loan term of 20 years, calculate the annual cost of this
wind farm using the formula above.
Next, estimate the average annual kWh output of the plant. A generous
estimate would be to assume that the plant would operate at an average
annual load factor of 30 percent over its life. This means it would be
running at rated capacity for 30 percent of the hours each year. This
would amount to 0.30 x 24 hrs/day x 365 days/ year or 2,628 hours/year.
At this load factor it would generate 200 MW x 1,000 kW/MW x 2,628 hours
= 525,600,000 kWh/year.
Thus, for the 200 MW wind farm, the estimate for its annual capital
cost/kWh would be: $46,983,850/525,600,000 kWh = $0.0894/kWh or
approximately $0.09/kWh. One can follow this same procedure for any type
of power plant.
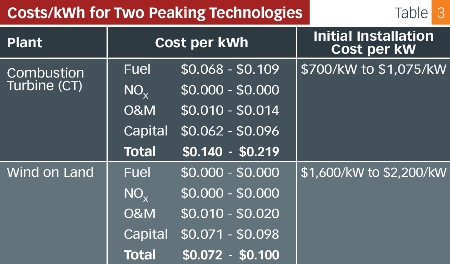
Now that all of the relevant costs/kWh for a power plant can be
obtained, let’s look at all of the costs/kWh for two of the peaking
technologies. Those costs are summarized in Table 3.
Assume that all of the other choices for peaking power except for the
combustion turbine and wind on land have been eliminated. At first
glance, it appears that wind on land is the clear winner. But is it?
All Table 3 shows is what the power plant’s total cost per kWh will be
if it operates at a 30 percent load factor. Now compare this total cost
per kWh to what you think a reasonable market price would be. You want
the total cost per kWh to be lower than a reasonable market price. Once
you know that each technology can be profitable, you need to go one step
further and consider the risks involved with each choice.
The risk the utility is taking in choosing the wind plant is weather
risk. If the wind does not blow coincident with the utility’s peak
demand, then this plant is useless. Note that the total costs/kWh for
the combustion turbine are double those compared to the total costs/kWh
for the wind on land plant. The utility pays a premium for the
combustion turbine because it is available 24 hours a day.
If, by looking at all of the costs/kWh there is still no definitive
answer for which technology is best, then why go through all of these
calculations? Having these costs/kWh for all of the technologies a
company is considering helps it to organize and recognize the risks
associated with each type of power plant. In other words, in this form
the utility can quickly see how sensitive each technology’s total costs
are to changes in fuel costs, changes in the cost of pollution credits,
changes in O&M costs and changes in load factor or capital costs. This
exercise allows the company to identify those technologies it wants to
consider for its final analysis, the capital investment analysis.
The company then chooses to perform a capital investment analysis on the
technologies that have a reasonable chance of being cost competitive in
their respective load factor market and which have risks the company
feels comfortable managing. In this final analysis, perform a 10-, 15-,
20- or 30-year net present value analysis on the cash flows for the
construction and operation of each relevant technology. The technology
that has the highest probability of maintaining a positive net present
value over the analysis period and under various changes in cost and
operating assumptions is the one the company should select.
In the end, when it comes to comparing the costs of generation
technologies, don’t automatically believe everything you hear or read. A
legitimate comparison of generation technologies takes into account load
factor, identifies risks associated with the costs/kWh for each
technology and then performs a net present value analysis on those
technologies with risks that the company feels comfortable managing.
This is the only the legitimate way to evaluate power generation
technologies.
John Hynes began his career in the energy industry in 1983. He
developed and facilitated technical training programs for nuclear
operators, telecommunications technicians, relay protection technicians
and high voltage equipment maintenance technicians before moving on to
senior positions in sales, marketing and strategic planning. Drawing on
perspectives gained from his wide-ranging background and real-world
management experience Hynes develops and facilitates Excidian’s Business
Finance and Energy Industry Knowledge programs.
![]() To subscribe or visit go to:
http://www.renewableenergyaccess.com
To subscribe or visit go to:
http://www.renewableenergyaccess.com