10 Year Monthly Forecast of US Treasury Yields
Location: Honolulu
Author:
Donald R. van
Deventer
Date: Monday, April 19, 2010
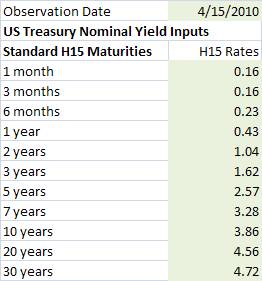
Today’s forecast for U.S. Treasury yields is based on the April 15, 2010 constant maturity Treasury yields reported by the Board of Governors of the Federal Reserve System in its H15 Statistical Release reported at 4:15 pm April 16, 2010. The “forecast” is the implied future coupon bearing U.S. Treasury yields derived using the maximum smoothness forward rate smoothing approach developed by Adams and van Deventer (Journal of Fixed Income, 1994) and corrected in van Deventer and Imai, Financial Risk Analytics (1996). The “forecast” for future U.S. dollar interest rate swap rates is derived from the maximum smoothness forward rate approach, but applied to the forward credit spread between the libor-swap curve and U.S. Treasury curve instead of to the absolute level of forward rates for the libor-swap curve.
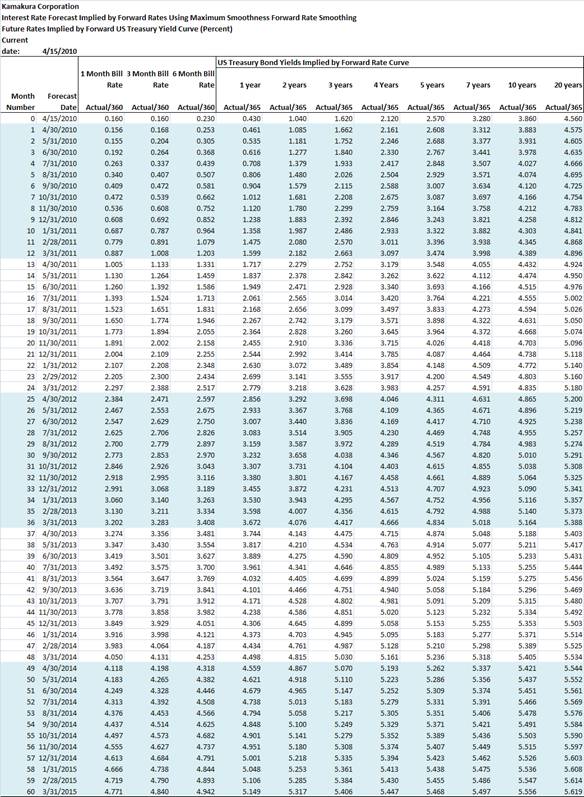
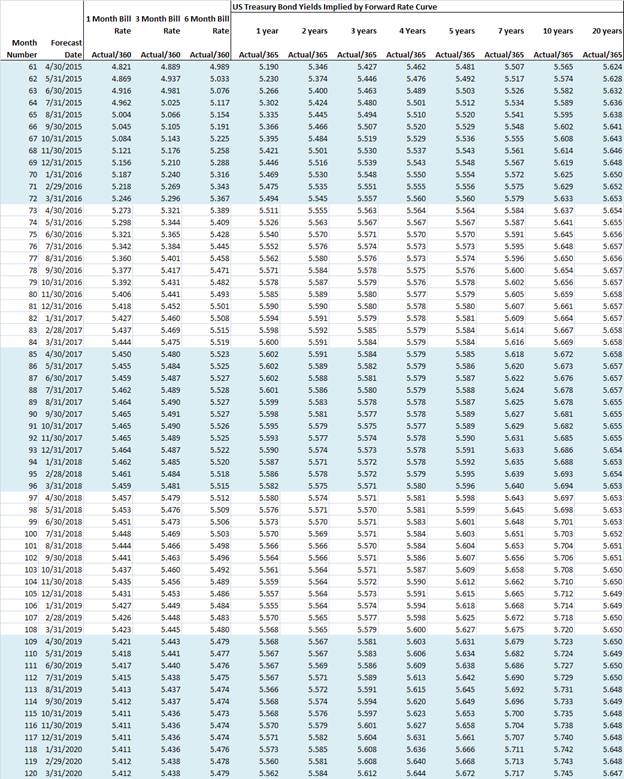
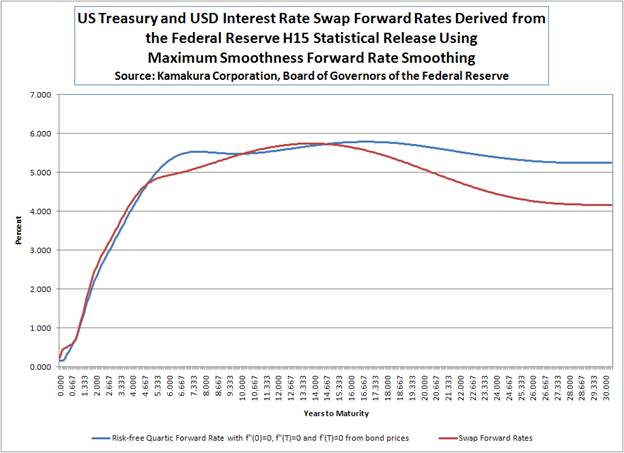
Today’s forecast shows 1 month Treasury bill rates peaking at 5.465% in the fourth quarter of 2017 and the 10 year U.S. Treasury yield at 5.745% on March 31, 2020. The negative 21 basis point spread between 30 year U.S. dollar interest rate swaps and U.S. Treasury yields reflects the blurring of credit quality between these two yield curves. The U.S. government is no longer seen as risk free, and 4 of the 8 panel banks that determine U.S. dollar libor are receiving massive government assistance and are, if effect, sovereign credits. For more on the panel members, see www.bbalibor.com.
Background Information on Input Data and Smoothing
The Federal Reserve H15 statistical release is available here:
http://www.federalreserve.gov/Releases/H15/Update/
The maximum smoothness forward rate approach to yield curve smoothing was described in this blog entry:
van Deventer, Donald R. “Basic Building Blocks of Yield Curve Smoothing, Part 10: Maximum Smoothness Forward Rates and Related Yields versus Nelson-Siegel,” Kamakura blog, www.kamakuraco.com, January 5, 2010. Redistributed on www.riskcenter.com on January 7, 2010.
The use of the maximum smoothness forward rate approach for bond data is discussed in this blog entry:
van Deventer, Donald R. “Basic Building Blocks of Yield Curve Smoothing, Part 12: Smoothing with Bond Prices as Inputs,” Kamakura blog, www.kamakuraco.com, January 20, 2010.
The reasons for smoothing forward credit spreads instead of the absolute level of the libor-swap curve was discussed in this blog entry:
van Deventer, Donald R. “Basic Building Blocks of Yield Curve Smoothing, Part 13: Smoothing Credit Spreads,” Kamakura blog, www.kamakuraco.com, April 7, 2010. Redistributed on www.riskcenter.com, April 14, 2010.
The Kamakura approach to interest rate forecasting was introduced in this blog entry:
van Deventer, Donald R. “The Kamakura Corporation Monthly Forecast of U.S. Treasury Yields,” Kamakura blog, www.kamakuraco.com, March 31, 2010. Redistributed on www.riskcenter.com on April 1, 2010.
Today’s Kamakura U.S. Treasury Yield Forecast
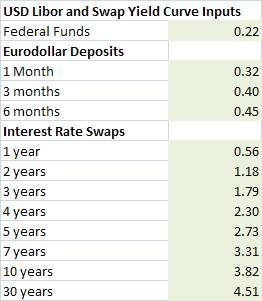
The Kamakura 10 year monthly forecast of U.S. Treasury yields is based on this data from the Federal Reserve H15 statistical release:
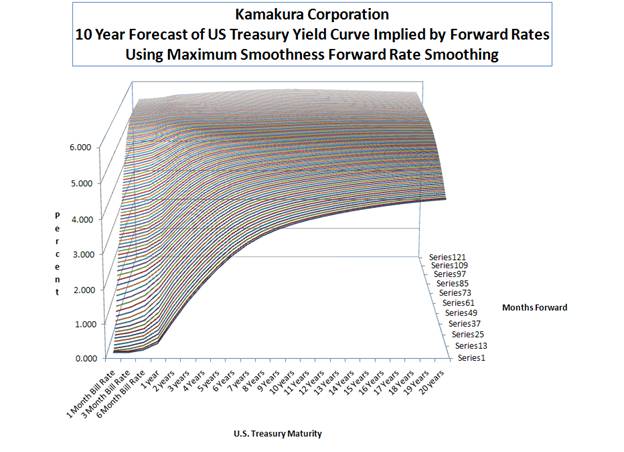
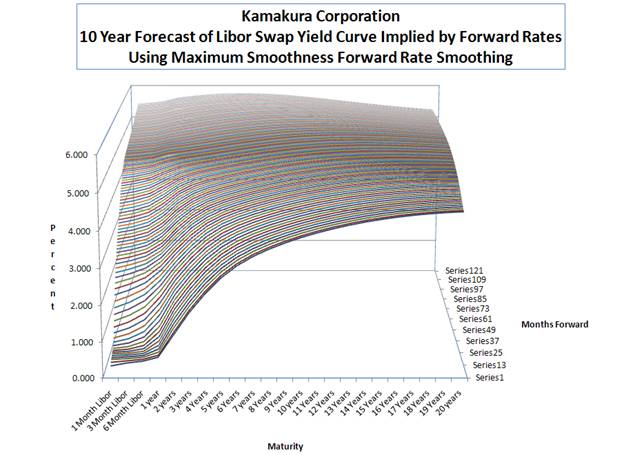
The graph below shows in 3 dimensions the movement of the U.S. Treasury yield curve 120 months into the future at each month end:
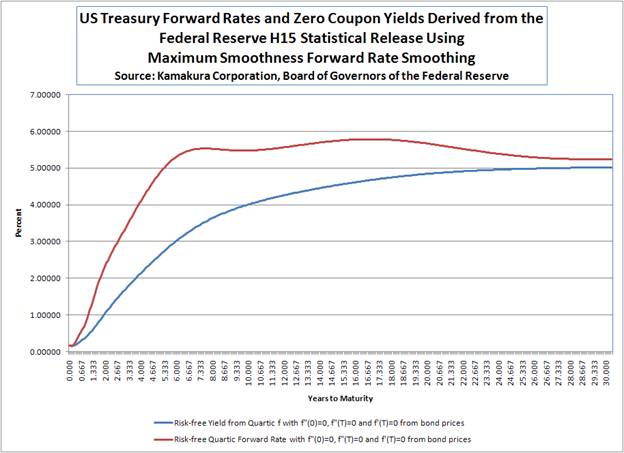
These yield curve movements are consistent with the continuous forward rates and zero coupon yields implied by the U.S. Treasury coupon bearing yields above:
In numerical terms, forecasts for the first 60 months of U.S. Treasury yield curves are as follows:
The forecasted yields for months 61 to 120 are given here:
Today’s Kamakura Forecast for U.S. Dollar Interest Rate Swap Yields and Spreads
Today’s forecast for U.S. Dollar interest rate swap yields is based on the following data from the H15 Statistical Release published by the Board of Governors of the Federal Reserve System:
Applying the maximum smoothness forward rate smoothing approach to the forward credit spreads between the libor-swap curve and the U.S. Treasury curve results in the following zero coupon bond yields:

The forward rates for the libor-swap curve and U.S. Treasury curve are shown here:
The 10 year forecast for U.S. dollar interest rate swap yields is shown in the following graph:
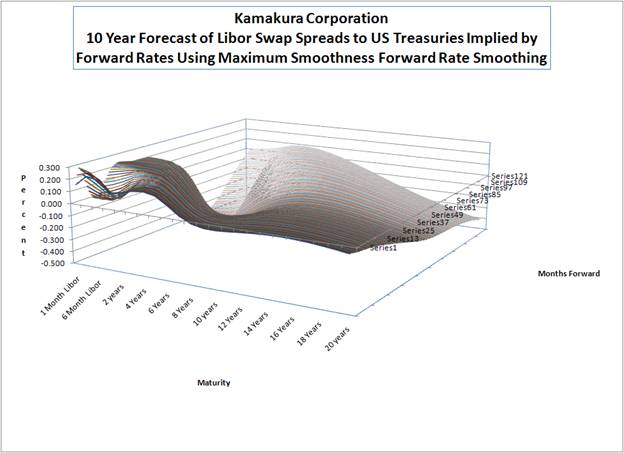
The 10 year forecast for U.S. dollar interest rate swap spreads to U.S. Treasury yields is given in the following graph:
The numerical values for the implied future U.S. dollar interest rate swap spreads to U.S. Treasury yields are given here for 60 months forward:

The numerical values for the implied future U.S. dollar interest rate swap spreads to U.S. Treasury yields are given here for 61-120 months forward:

For more information about the yield curve smoothing and simulation capabilities in Kamakura Risk Manager, please contact us at info@kamakuraco.com. Kamakura interest rate forecasts are available in pre-formatted Kamakura Risk Manager data base forecasts.

To subscribe or visit go to: http://www.riskcenter.com