NASA releases global warming map
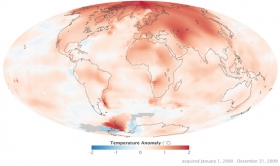
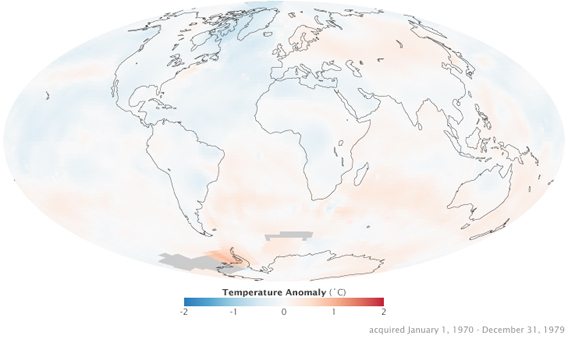
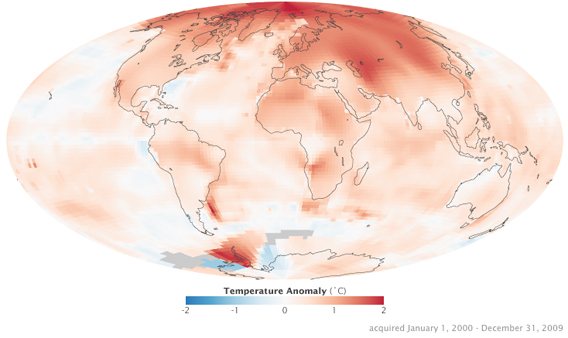
NASA has released a new analysis of temperature change. The map shows temperature anomalies for 2000-2009 and 1970-1979 relative to a 1951-1980 baseline.
To conduct the analysis, NASA's Goddard Institute for Space Studies (GISS) uses "publicly available data from 6,300 meteorological stations around the world; ship-based and satellite observations of sea surface temperature; and Antarctic research station measurements."
"These three data sets are loaded into a computer analysis program—available for public download from the GISS web site—that calculates trends in temperature anomalies relative to the average temperature for the same month during 1951-1980," according to NASA.
1970-1979
2000-2009
 NASA images by Robert Simmon, based on data from the Goddard
Institute for Space Studies.
NASA images by Robert Simmon, based on data from the Goddard
Institute for Space Studies.
The space agency reports that the average global temperature has
increased by about 0.8° Celsius (1.4° Fahrenheit) since 1880. About
two-thirds of the warming has occurred since 1975, at a rate of roughly
0.15-0.20°C per decade.
"The world is getting warmer," stated NASA on its Earth Observatory
site. "Whether the cause is human activity or natural variability,
thermometer readings all around the world have risen steadily since the
beginning of the Industrial Revolution."
Copyright
mongabay
2010 To subscribe or visit
go to: http://news.mongabay.com