Have you ever wondered why the CPI, GDP and employment numbers run counter to your personal and business experiences?
The problem lies in biased and often-manipulated government reporting.

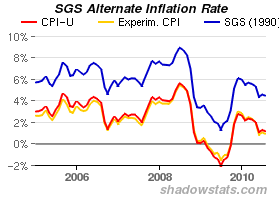
Alternate Inflation Charts
The CPI chart on the home page reflects our estimate of inflation for today as if it were calculated the same way it was in 1990. The CPI on the Alternate Data Series tab here reflects the CPI as if it were calculated using the methodologies in place in 1980. In general terms, methodological shifts in government reporting have depressed reported inflation, moving the concept of the CPI away from being a measure of the cost of living needed to maintain a constant standard of living.
Further definition is provided in our CPI Glossary. Further background on the SGS-Alternate CPI series is available in the Archives in the August 2006 SGS newsletter.

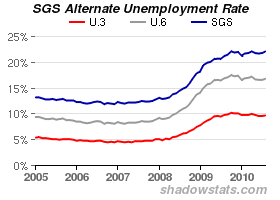
Alternate Unemployment Charts
The seasonally-adjusted SGS Alternate Unemployment Rate reflects current unemployment reporting methodology adjusted for SGS-estimated long-term discouraged workers, who were defined out of official existence in 1994. That estimate is added to the BLS estimate of U-6 unemployment, which includes short-term discouraged workers.
"Shadow Government Statistics"
johnwilliams@shadowstats.com
Tel: (415) 512-7701
American Business Analytics & Research LLC
The Hearst Building
5 Third Street, Suite 1301
San Francisco, CA 94103
To subscribe or visit go to: http://www.shadowstats.com/