US electrical generation – Where we are now
Last week, Hannes Kunz and Nate Hagens put up one post talking about electricity, and they are planning another post in the near future. I thought now might be a good time to put up a few graphs regarding US electricity generation, showing where we are now. Most of the graphs are summaries of data from the Energy Information Administration website, either from the renewables section, or the electricity section.
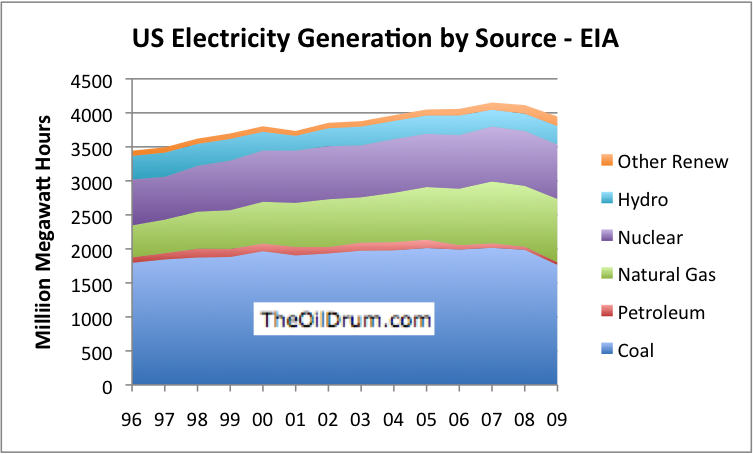
Figure 1 – Amounts of US Electricity Generated by SourceFigure
1 shows the largest source of US electricity is from coal. Following
behind these are natural gas and nuclear. The amount of electricity
generated using natural gas and nuclear have both grown in recent
years–natural gas because more natural gas generation was built;
nuclear because ways were found to increase the amount of
electricity obtained from existing plants, by upgrading their
capacity and by operating them more hours. “Other renewables” have
grown from 2.2% of the total in 1996 to 3.57% of the total in 2009.
Pretty much all of this increase has taken place in the last four
years.
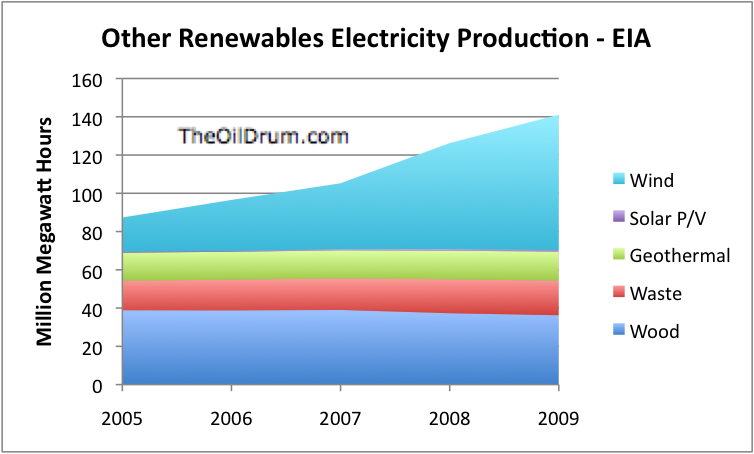
Figure 2Figure 2 just breaks out the “other renewables” into their component parts during the last five years. Wind is responsible for nearly all of the increase. Solar is not large enough in quantity to show up on the graph. Geothermal, biomass waste (which includes biogas), and wood have all been close to flat, at least in terms of the electricity actually generated in the past few years. The amount of electricity generated by wood has been declining.
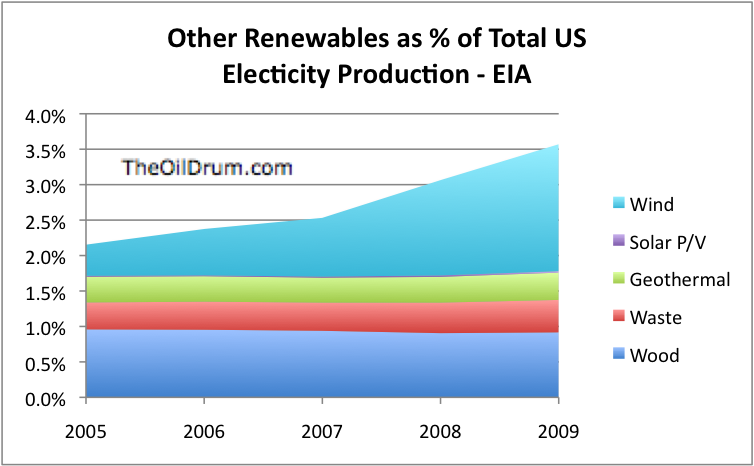
Figure 3Figure 3 is similar to Figure 2, but shows the
“other renewables” as a percentage of total electricity generated.
Wind grew from 0.4 % of US electricity generated in 2005 to 1.8% of
US electricity generated in 2009. Wood (including wood chips)
represents about 0.9% of electricity production; waste has grown
from a bit under 0.4% to a bit over 0.4%% duriing this period.
Geothermal is a little under 0.4% of US electricity. In total, as
mentioned above, these other renewables amounted to 3.57% of US
electricity in 2009.
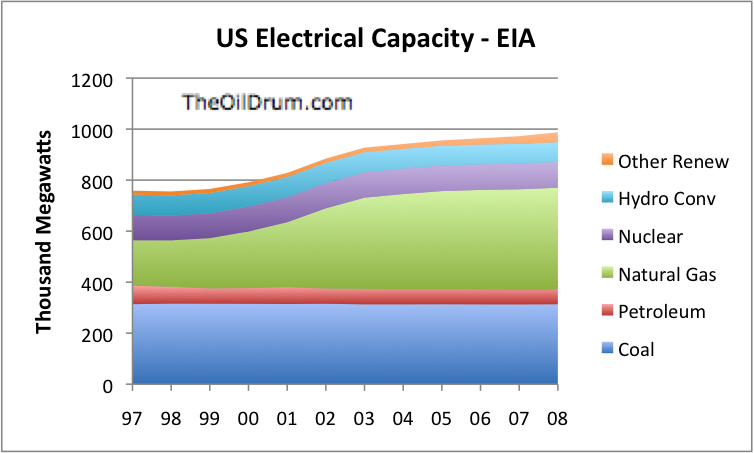
Figure 4US electrical generating capacity
has grown greatly in recent years. The biggest share of the increase
has been in natural gas generation, particularly in the 1999 to 2003
period. Prior to about 2000, gas prices were about $2 per thousand
cubic feet at the wellhead, and this inexpensive price no doubt
played a role in the ramp-up. Natural gas plants were also
relatively quick and inexpensive to construct, and could act as
“peaking plants” (plants operated for short periods of time, but at
high prices, when demand was high), and thus could take advantage of
high wholesale electricity prices, for short periods of time.
Other renewable generation capacity also increased, reaching 3.8% of total generation capacity by the end of 2008.
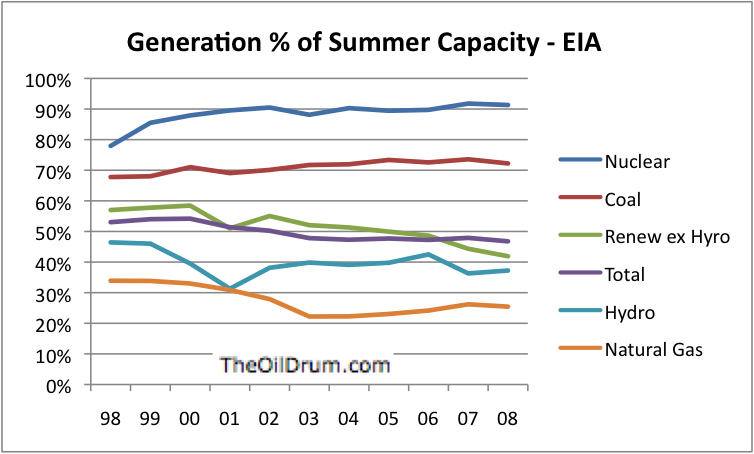
Figure 5Figure 5 compares the utilization of the various
types of power plants, and shows how this has been changing. In this
calculation and in Figure 6, the calculation is made by dividing the
actual electricity produced by the theoretical capacity, where the
theoretical capacity is the average of the year-end capacity for the
year indicated and the year prior. This averaging process with
respect to capacity is used to get an estimate of how much capacity
was, on average, available during the year.
Nuclear plants now operate at a little over 90% of their theoretical capacity. There is little room for improvement.
Coal plants operate on average a little over 70% of the time. Many of them are taken off line at night.
Renewables ex hydro have been trending down in their utilization of capacity, most likely because of a changing mix away from wood and geothermal (with high capacity utilization) to more wind. More detail will be shown in Figure 6.
Natural gas utilization has declined significantly, with the building of all the new natural gas plants. If the average utilization of capacity is only about 25%, and some plants intended to operate most of the time (50% to 70% or capacity), then some plants must be used very little.
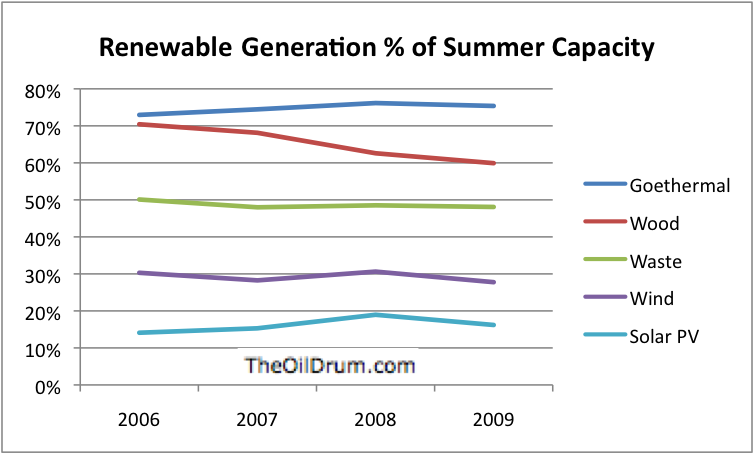
Figure 6Figure 6 shows the percentage of capacity used by
other renewables. Geothermal is highest, using over 70% of capacity.
Wood utilization of capacity has dropped from a shade over 70% to about 60%. (We noted above that total electricity generated from wood was declining slightly.) Some of the wood is waste product from industrial processes (paper manufacturing, construction). To the extent that this source of fuel is depressed because of the economy, it may be affecting the percentage of wood electricity generating capacity being used.
Wind utilization of capacity does not seem to be trending upward. The average for the four years is 29%, which is better than Europe, but not as good as folks manufacturing new wind turbines are advertising.
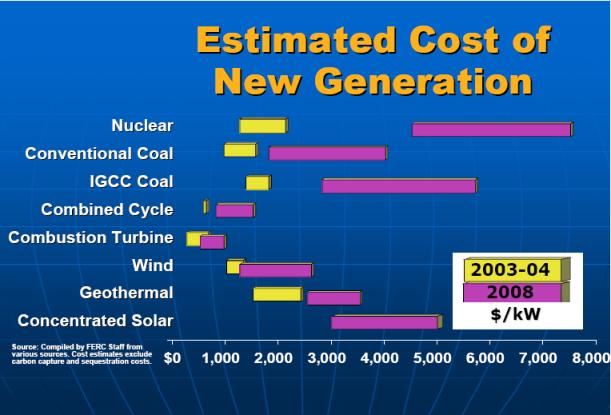
Figure 7Figure 7 is graph of FERC estimates of the cost of
new capacity. Of course, some of these sources are operated more
hours than others.
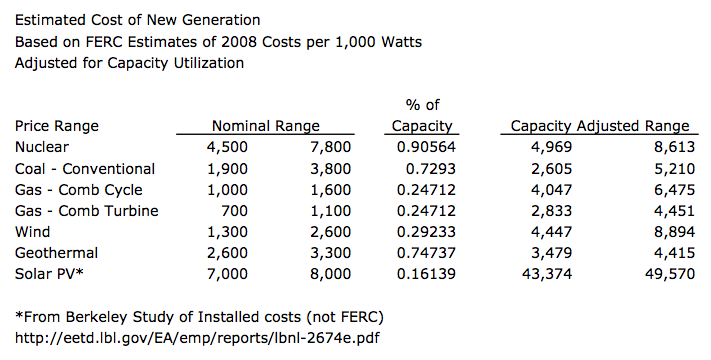
Figure 8Figure 8 is a little calculation I made, trying to
figure out the cost of capacity on more of a comparable basis,
adjusting for utilization.
In Figure 8, the nominal costs per 1,000 watts of capacity are my estimates regarding what the FERC amounts shown in Figure 7 are, underlying the graph amounts. The percentage of capacity is the average of the last four years of the actual percentage of summer capacity, from Figure 5 or 6. The adjusted cost of comparable capacity shown in the last two columns is simply the nominal capacity divided by the utilization.
One can argue whether these numbers are comparable, even after adjustment. For one thing, there are differences in the quality of electricity produced–whether it is available on demand, or not. There are also differences in how many years plants can be expected to operate, operating costs, and the cost of fuel.
On this basis, wind comes out comparable in cost to nuclear, but without the cost of nuclear fuel. Coal and natural gas seem to be quite a bit cheaper (neglecting the considerable cost of fuel). Geothermal seems to be especially cost effective when one considers the lack of fuel costs.
I have added a line for Solar PV, based on the indications of this study from Berkeley regarding the installed cost of solar PV. The numbers are so high that one wonders whether something is wrong with the calculation.
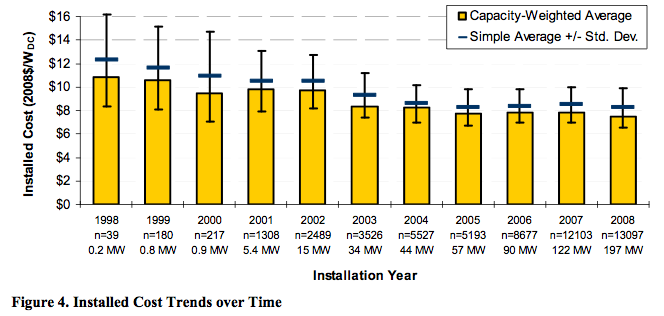
Figure 9This is a graph from the Berkeley report showing
the trend in installed solar PV costs. There are a lot of costs in
the installation besides the PV itself–including the inverter, and
the cost of installation. I also don’t know how accurate the
percentage of capacity that seems to come out of the EIA data is. It
seems to average only about 16% – reflecting a combination of
factors including how many hours sun is available, how much shading
there is on the panels, how well the panels are installed, and how
clean the panels are kept.
The indicated solar PV cost is extremely high compared to the other costs. I can delete the solar PV indications, if someone can explain how they are incorrect. But they are somewhat concerning.
TheOilDrum To subscribe or visit go to/