Unrest in Middle East and North Africa
Key oil region in the spotlight
By Margaret McQuaile and Richard Swann
February 24, 2011 - On January 5 this year, a young Tunisian jobless
graduate called Mohamed Bouazizi doused himself with gasoline and set
himself alight after police took away the fruit and vegetables he was
selling illegally. In doing so, he lit the flame under an unprecedented
wave of political protest across North Africa and the Middle East that
has brought down the governments of Tunisia and Egypt.
Since then unrest has exploded in Libya with deadly consequences for
many of those involved, posing the biggest challenge so far to energy
markets. Protests have also spread to Algeria, Bahrain, Yemen, Jordan
and Morocco.
Bouazizi’s death brought into focus the changing demographics of North
Africa and the Middle East, where the biggest groups in most populations
are young adults, many of them educated, desperate for jobs and
insistent on having a say in the way they are governed.
Not all these countries are oil and gas producers, but they belong to a
region that accounts for roughly 40% of world oil supply. Some are major
suppliers of oil or natural gas, or both. Algeria is a major supplier of
gas to Europe. Libya is a significant oil exporter and holder of
Africa's biggest reserves. Bahrain is a minor player in the oil and gas
world, but its proximity to OPEC kingpin Saudi Arabia-- which alone
currently supplies some 10% of the world’s oil needs—and the fact that
it hosts the US Fifth Fleet underlines the seriousness of the political
unrest in the tiny emirate.
Not surprisingly, oil prices, which were already in the low $90s/barrel
at the beginning of 2011, have climbed further, with North Sea ICE Brent
futures hitting $100/b on January 31 as the protests in Egypt gained
momentum, spurring fears of disruption to oil shipments along the Suez
Canal and Sumed Pipline. By February 23, after several days of violent
clashes in Libya, Brent futures had broken above $109/b.
Morocco
Population: 31.6 million
GDP per capita $2,868
Proven crude reserves: 100 million barrels
Gas reserves: 1.5 billion cubic meters
Crude production: 4,053 b/d (ie, 0.004 mil b/d)
Gas production: 60 million cubic meters/year
Algeria
Population: 35.4 million
GDP per capita $4,478
Proven crude reserves: 12.2 billion barrels
Gas reserves: 4.5 trillion cubic meters
Crude production: 1.26 million b/d
Gas production: 81.43 billion cubic meters/year
Tunisia
Population: 10.6 million
GDP per capita $4,160
Proven crude reserves: 0.6 billion barrels
Gas reserves: 2.97 billion cubic meters
Crude production: 86,000 b/d
Gas production: 65.13 billion cubic meters/year
Libya
Population: 6.41 million
GDP per capita $12,062
Proven crude reserves: 46.42 billion barrels
Gas reserves: 1.55 trillion cubic meters
Crude production: 1.58 million b/d
Gas production: 15.9 billion cubic meters/year
Egypt
Population: 80.5 million
GDP per capita $2,771
Proven crude reserves: 4.4 billion barrels
Gas reserves:
Crude production: 742,000 b/d
Gas production: 62.7 billion cubic meters/year
Jordan:
Population: 6.4 million
GDP per capita $4,434
Gas reserves: 2.97 billion cubic meters
Gas production: 250 cubic meters/year
Syria
Population: 22.2 million
GDP per capita $2,892
Proven crude reserves: 2.5 billion barrels
Gas reserves:
Crude production: 376,000 b/d
Gas production: 5.8 billion cubic meters/year
Saudi Arabia
Population: 25.4 million
GDP per capita $16,641
Proven crude reserves: 264.59 billion barrels
Gas reserves: 7.9 trillion cubic meters
Crude production: 8.4 million b/d
Gas production: 78.45 billion cubic meters/year
Yemen
Population: 23.5 million
GDP per capita $1,231
Proven crude reserves: 2.7 billion barrels
Gas reserves: 0.49 trillion cubic meters
Crude production: 298,000 b/d
Gas production: 454,700 cubic meters/year
Oman
Population: 2.97 million
GDP per capita $18,041
Proven crude reserves: 5.6 billion barrels
Gas reserves:
Crude production: 810,000 b/d
Gas production: 24.8 billion cubic meters/year
UAE
Population: 4.62 million
GDP per capita $47,407
Proven crude reserves: 97.8 billion barrels
Gas reserves:
Crude production: 2.34 million b/d
Gas production: 48.84 billion cubic meters/year
Qatar
Population: 1.64 million
GDP per capita $74,423
Proven crude reserves: 25.38 billion barrels
Gas reserves: 25.4 trillion cubic meters
Crude production: 820,000 b/d
Gas production: 89.3 billion cubic meters/year
Bahrain
Population: 38,004
GDP per capita $19,641
Proven crude r eserves:
Gas reserves: 0.09 trillion cubic meters
Crude production: 48,560 b/d
Gas production: 12.8 billion cubic meters/year
Kuwait
Population: 3.48 million
GDP per capita $32,530
Proven crude reserves: 101.5 billion barrels
Gas reserves:
Crude production: 2.31 million b/d
Gas production: 11.49 billion cubic meters/year
Iraq
Population: 31.23 million
GDP per capita $2,626
Proven crude reserves: 115 billion barrels
Gas reserves:
Crude production: 2.66 million b/d
Gas production: 1.15 billion cubic meters/year
Iran
Population: 74.1 million
GDP per capita $4,484
Proven crude reserves: 137 billion barrels
Gas reserves:
Crude production: 3.66 million b/d
Gas production: 175.7 billion cubic meters/year
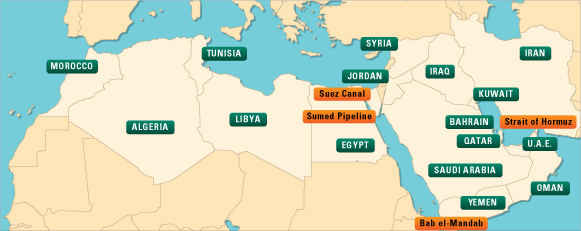
Chokepoints
Strait of Hormuz
The Strait of Hormuz lies at the mouth of the Persian Gulf between Iran
and Oman and is just 21 miles wide at its narrowest point. The US Energy
Information Administration estimates that 15.5 million b/d of oil moved
through the Strait of Hormuz in 2009, down from a peak of 17 million b/d
in 2008 when flows through this narrow waterway represented 40% of
global seaborne oil trade.
Suez Canal
Back in the 1950s, close to 10% of world oil supply moved from the
Middle East to Europe and the United States along the Suez Canal.
Nowadays, the figure is less than 1%, thanks to the introduction of Very
Large Crude Carriers which have made it economical to ship oil around
Africa. But the Suez Canal is still an important chokepoint because a
closure of this waterway would increase the cost of moving Middle East
oil to western markets and would lengthen voyage times considerably.
The International Energy Agency, using Suez Canal Authority data, says
northbound shipments of crude through the Canal averaged 317,000 b/d in
2009 while southbound shipments averaged 274,000 b/d. Fuel shipments
averaged 25,000 b/d northbound and 206,000 b/d southbound, and light
products 650,000 b/d northbound and 366,000 b/d southbound.
LNG traffic has been increasing along the Canal. The IEA says some 20
billion cubic meters of mostly Qatari LNG was shipped through the Canal
in 2009 and that this volume probably jumped to as much as 30 or 35
billion cubic meters in 2010 as a result of the rapid expansion of
Qatar's liquefaction capacity.
Sumed Pipeline
The 200-mile Suez-Mediterranean pipeline, which carries crude from the
Red Sea to the Mediterranean, has been running at less than half its 2.4
million b/d capacity, with throughput at the end of 2010 reckoned to be
around 1.1 million b/d, according to a recent International Energy
Agency report. The IEA says disruption of Sumed flows would add 8-10
days to transatlantic voyages and 15 days to voyages to Europe.
Shareholders in Sumed are Egyptian state oil company EGPC with 50%,
Saudi Aramco and Abu Dhabi’s International Petroleum Investment Company
with 15% each, the Kuwait Investment Authority with 14.22%, Qatar
Petroleum 5% and two other Kuwaiti companies with a combined share of
less than 1%.
Bab el-Mandab
Most oil exports from the Persian Gulf heading for the Suez Canal and
Sumed Pipeline also pass through the Bab el-Mandab, a strait between
Yemen, Djibouti and Eritrea that is 18 miles wide at its narrowest
point. The US Energy Information Administration estimates that 3.2
million b/d of oil flowed through the strait in 2009, down from 4
million b/d in 2008, toward Europe, the US and Asia. The bulk of the
flows, averaging 1.8 million b/d, moved north toward the Suez Canal and
Sumed Pipeline.
Sources: OPEC Annual Statistical Bulletin 2009, BP Statistical Review of
World Energy 2010, CIA World Factbook, International Energy Agency, US
Energy Information Administration. OPEC crude production estimates are
from Platts’ survey of January production. BP oil production statistics
include NGLs.