February Ranked 17th Warmest on Record
March 15, 2011
This year, the globe experienced the 17th warmest February since record keeping began in 1880, as the climate phenomenon La Niña continued to be a significant factor. Last month’s average Arctic sea ice extent tied with 2005 as the smallest extent for February in its 32-year period of record.
The monthly analysis from NOAA’s National Climatic Data Center is part of the suite of climate services NOAA provides government, business and community leaders so they can make informed decisions.
Global Temperature Highlights – February
- The combined global land and ocean average surface temperature
for February 2011 was the 17th warmest on record at 54.62 F (12.50
C), which is 0.72 F (0.40 C) above the 20th century average of 53.9
F (12.1 C). The margin of error associated with this temperature is
+/- 0.18 F (0.10 C).
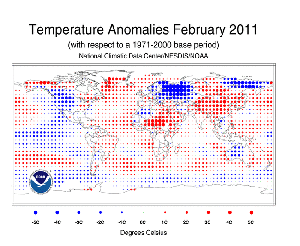
- Separately, the global land surface temperature was 0.92 F (0.51 C) above the 20th century average of 37.8 F (3.2 C), which tied for the 28th warmest February on record. The margin of error is +/- 0.56 F (0.31 C). Warmer-than-average conditions occurred across most of Asia, central Africa, northern Alaska and southern Greenland. Cooler-than-average regions included Eastern Europe, western Russia, eastern Siberia and the western United States.
- The February global ocean surface temperature was 0.65 F (0.36 C) above the 20th century average of 60.6 F (15.9 C), making it the 10th warmest February on record. The margin of error is +/- 0.13 F (0.07 C). The warmth was most pronounced across the northern Pacific Ocean, the tropical Atlantic Ocean and part of the North Atlantic near Greenland and Canada.
Global Temperature Highlights – December 2010 – February 2011
- The combined global land and ocean average surface temperature
for Northern Hemisphere winter (December 2010 – February 2011) was
0.70 F (0.39 C) above the 20th century average of 53.8 F (12.1 C),
making it the 16th warmest on record. The margin of error is +/-
0.16 F (0.09 C).
- The December 2010 – February 2011 worldwide land surface temperature was 0.81 F (0.45 C) above the 20th century average of 37.8 F (3.2 C) — the 26th warmest such period on record. The margin of error is +/- 0.32 F (0.18 C). Warmer-than-average conditions were particularly felt across eastern Canada, southern Greenland and northern Siberia. Cooler-than-average regions included Eastern Europe, western Russia and Mongolia.
- The global ocean surface temperature for December 2010 –
February 2011 was 0.65 F (0.36 C) above the 20th century average of
60.5 F (15.8 C) and tied for the 10th warmest such period on record.
The margin of error is +/-0.13 F (0.07 C). The warmth was most
pronounced across the northern Pacific Ocean, the tropical Atlantic
Ocean, and the North Atlantic, near Greenland and Canada.
- La Niña conditions weakened in February, although sea-surface temperatures remained below normal across the central and eastern equatorial Pacific Ocean. According to NOAA’s Climate Prediction Center, La Niña will continue to have global impacts for the next several months, but neither La Niña nor El Niño are expected to affect the region by June.
Polar Sea Ice and Precipitation Highlights
- The average Arctic sea ice extent for February was 5.54 million square miles (14.36 million square km), which is 8.2 percent below average. This ties with February 2005 as the smallest February Arctic sea ice extent since records began in 1979 and is the third consecutive month with record low Arctic ice extent.
- For the winter period, the Northern Hemisphere snow cover extent over land averaged 760,000 square miles (1.98 million square km) above average, ranking as the third largest seasonal snow cover extent on record behind the winters of 1977–1978 and 2009–2010. The North American season snow cover extent was the third largest on record, while Eurasia’s was fourth largest.
- Average rainfall across Australia was 76 percent above average during February, making it the second wettest February on record behind 2000. Rainfall in South Australia was more than four times above average, the wettest February on record for the state. The summer period (December 2010 – February 2011) was the second wettest summer on record for Australia.
Scientists, researchers and leaders in government and industry use NOAA’s monthly reports to help track trends and other changes in the world's climate. This climate service has a wide range of practical uses, from helping farmers know what and when to plant, to guiding resource managers with critical decisions about water, energy and other vital assets.
NOAA’s mission is to understand and predict changes in the Earth's environment, from the depths of the ocean to the surface of the sun, and to conserve and manage our coastal and marine resources. Visit us on Facebook.
* Included in this report: Based on requests from our users, NOAA is now making it easier to find information in its global State of the Climate report about margins of error associated with its global temperature calculations. NCDC previously displayed this information in certain graphics associated with the report, but it will now publish these ranges in the form of “plus or minus” values associated with each monthly temperature calculation. These values are calculated using techniques published in peer-reviewed scientific literature. More information.
