Europe is leader in PV solar cell deployment

Germany remains top of the list with and accounts for more than 63% of the PV installations worldwide. Having said that, PV production volume is now dominated by manufacturing in Asia where China and Taiwan now account for about 74% of the world supply
Photovoltaic (PV) industry revenues reached a record $US 93
billion in 2011, a 13.4% increase over $US 82 billion in 2010, and a
150% increase over revenues in 2009.
Materials currently used for photovoltaics include monocrystalline,
polycrystalline and amorphous silicon, CdTe, CIGS (where S stands
for diselenide or sulphide) and multijunction III-V compound
semiconductors. Silicon is now being overtaken by the other
materials due to efficiency issues, with III-Vs leading the way due
to their extraordinarily high efficiency of around 40%. The main
thing however, that hinders their deployment is the expense
involved.
According to EPIC's Photovoltaic Industry Report, globally, 27.4 GW
of PV were installed, bringing cumulative PV electrical generation
capacity to 68 GW at the end of 2011. installations grew by 56%
compared to 2010.
Europe remains the leader for deployment, accounting for more than
63% of the PV installations worldwide. About 27% of all the
installations world-wide took place in Germany. These percentage
figures are lower than those for 2010, and they indicate the growing
importance of PV markets outside of Europe, and in particular in
China.
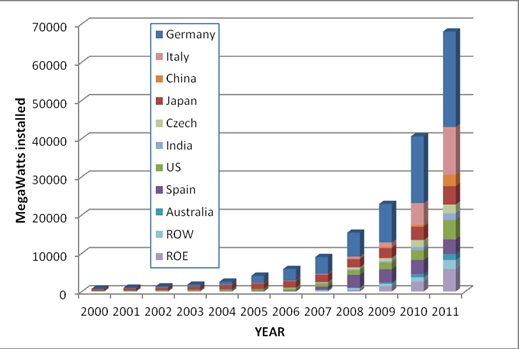
Worldwide, 68 GW cumulative were installed by the end of 2011. PV
capacity is now 28% as large as the park of wind turbines.
In Europe, 41 GW of electrical generation capacity from all sources
were installed in 2011, as compared to 57.6 GW in 2010. This
decrease is due in part to the economic recession which strengthened
in Europe throughout the year. For the first time ever, more PV
generating power was installed in Europe than any other energy
source, surpassing both natural gas and wind turbine generation.
New Eu PV at 17.3 GW out-paced natural gas installations by 58%.
However on a world-wide basis, wind power remains the dominant new
renewable energy source with installations of over 40 GW in 2011. By
2011, the cumulative installed PV generating base reached 68 GW. By
comparison, this represents about 28% of the installed wind base of
238 GW.
.jpg)
More than 40 GW of new electrical energy installations were
completed in Europe in 2011. Photovoltaic power was the leading
product. Renewables account for 67% of the total mix.
In terms of production, 7.6% more wattage of PV cells was
manufactured than generating capacity installed (29.5 GW compared to
27.4 GW). Inventories at the end of 2011 amounted to less than 1
month. Our figure of merit, (the ratio of total sector revenues to
installed PV generation capacity) for 2011 improved significantly to
US$3.53 per watt by 24% compared to US$4.6 per watt in 2010.
PV production volume is now dominated by manufacturing in Asia where
China and Taiwan now account for about 74% of the world supply.
Production by European companies declined sharply in 2011 to less
that 6% of the global total. Because many of the remaining companies
manufacture some of their products in Asia, the actual amount of
manufacturing activity in Europe is even less significant.
Source: http://www.compoundsemiconductor.net
© Copyright 1999-2012 RenewableEnergyWorld.com - All rights reserved. http://www.renewableenergyworld.com