U.S. Housing : Home Get Pricier For 14th Straight Months, Says The FHFA Home Price Index
Mortgage rates and markets change constantly. Stay 100% current by taking The Mortgage Reports by email each day. Click here to get free email alerts, or subscribe to the RSS feed in your browser.

The U.S. housing market continues to make gains.
Earlier this week, the Federal Housing Finance Agency (FHFA) said home values rose another 0.7% between March and April 2013, on average, resulting in a 12-month improvement of 7.4 percent.
April marks the 14th straight month during which home values improved.
Click to get your personalized home mortgage rate.
Home Price Index : 14 Straight Months Of Gains
Each month, the government publishes its Home Price Index (HPI), a home-valuation tracker with data on the state, regional, and national levels.
The Home Price Index works by tracking the change in home price between subsequent sales of the same home. Home price data supplied to the FHFA as part of the mortgage approval process; the FHFA "owns" conventional home loan backers Fannie Mae and Freddie Mac.
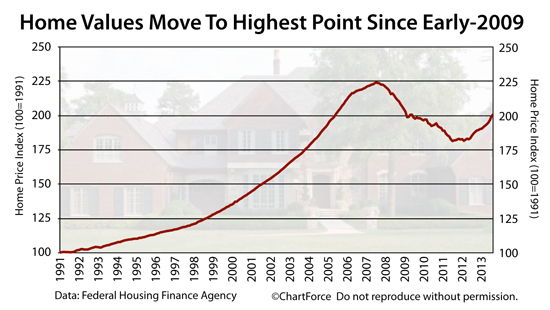
The valuation index is benchmarked to 100, a value which represents the U.S. housing market as it existed in 1991.
In April 2013, for the first time in four years, the FHFA Home Price Index crossed 200, moving to 200.8. This marks the highest reading for the index dating back to October 2008.
Despite its gains, however, optimism for the Home Price Index should remain muted. Like all home price indices, the HPI is a flawed metric.
As one glaring example, the HPI sample set is skewed heavily. The Home Price Index only includes data for homes financed via Fannie Mae and Freddie Mac, specifically ignoring homes financed with an FHA-backed mortgage, a VA guaranty loan, or a jumbo mortgage.
As FHA and VA market share grows -- specifically among first-time home buyers -- these specific exclusions have a greater impact on the final HPI value. Homes bought with cash are ignored, too, eliminating an over-weighted share of homes sold for less than $100,000.
A second flaw in the Home Price Index is that it tracks home resales only, which means that new home sales are ignored. New home sales currently account for close to 10% of home sales nationwide.
Lastly, the Home Price Index is published on a 60-day delay.
It's nearly July yet we're discussing the housing market as it existed in April. A lot can change in 3 months and "stale data" is of little use to buyers and sellers in rapidly changing markets such as Marin County, California; Detroit, Michigan; and Phoenix, Arizona.
Click to get your personalized home mortgage rate.
Arizona, Colorado Lead Mountain Region Gains
The FHFA's Purchase-Only Home Price Index rose 0.7 percent between March and April 2013, and has climbed 7.4% in a year. Since bottoming in October 2011, and have returned to October 2008 levels.
However, like all things in real estate, the Home Price Index is local. Home value changes have varied on a regional level, with some areas posting huge annual gains for the twelve months ending April 2013 and others posting small ones.
The Mountain Region, for example, which includes Arizona and Colorado, has shown large gains since last year. The Middle Atlantic Region has not.
Here is a sampling of the annual HPI data from the FHFA's 9 U.S. regions :
- Pacific : +17.1% (Hawaii, Alaska, Washington, Oregon, California)
- Mountain : +14.8% (Montana, Idaho, Wyoming, Nevada, Utah, Colorado, Arizona)
- Middle Atlantic : +2.9% (New York, New Jersey, Pennsylvania)
- East North Central : +5.2% (Michigan, Wisconsin, Illinois, Indiana, Ohio)
- South Atlantic : 6.6% (Delaware, Maryland, District of Columbia, Virginia, West Virginia, North Carolina, South Carolina, Georgia, Florida)
In addition, the West South Central Region gained +4.6% over the past year. The region houses Oklahoma, Arkansas, Texas, Louisiana.
Nationwide, home values remain roughly 10% below the April 2007 peak.
How Much Home Can You Afford
Home prices rose through all of 2012 and 2013 started strong. Ultra-low mortgage rates, rising rents, and pent-up demand from home buyers has fueled today's housing market recovery. Home affordability is high, but it likely won't last.
Do you know how much home you can afford? Start by setting a monthly budget and, if you plan to buy later in the year, consider adding one percentage point to today's rates. Mortgage rates are expected to rise into 2014.