HARP Mortgage Statistics : HARP Closings Per Capita, By State, Since 2009
Mortgage rates and markets change constantly. Stay 100% current by taking The Mortgage Reports by email each day. Click here to get free email alerts, or subscribe to the RSS feed in your browser.

It's been four-and-one-half years since the Home Affordable Refinance Program launched. Better known as "HARP", the mortgage for underwater homeowners has been used more than 2.7 million times in total, and there's a chance Congress could soon pass HARP 3 which would amplify closing totals through 2015.
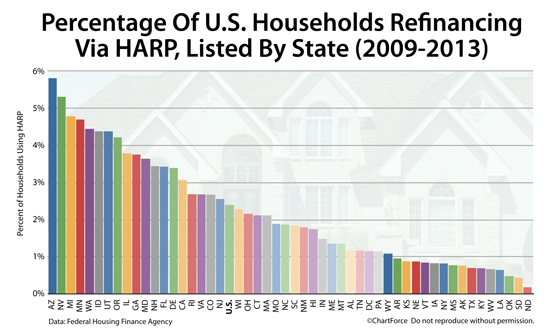
U.S. homeowners don't use the HARP refinance equally, however. The program has made a disparate impact by state.
Nearly 6% of Nevada homeowners have used HARP since its inception. In Kentucky, the figure is less than one percent.
Want today's live HARP mortgage rates? Click here.
HARP : "A Better Bargain For U.S. Homeowners"
HARP is an acronym, short for the Home Affordable Refinance Program. Part of the housing stimulus program launched in 2009, HARP is rolled under the government's Making Home Affordable program and is sometimes called the Obama Refi.
When HARP was first launched, the United States was already in a post-crisis world. Merrill Lynch had been absorbed by Bank of America; Fannie Mae and Freddie Mac had been placed into conservatorship; and, homeowners were losing their home equity rapidly.
However, at the same time, mortgage rates were dropping.
Between August 2008 and March 2009, the average conforming 30-year fixed rate mortgage dropped 148 basis points, moving from 6.48% before the crash to 5.00% after it. Plus, rates were still falling.
Unfortunately, many U.S. homeowners had already lost too much home equity to qualify to refinance.
Via HARP, homeowners got help.
For homeowners whose homes had lost equity, and whose homes were backed by Fannie Mae or Freddie Mac, refinancing was allowed without regard for falling home values. Furthermore, homeowners were not required to take on new private mortgage insurance (PMI) -- even if their home's loan-to-value (LTV) post-refinance was over 80%.
Click here for today's HARP mortgage rates.
HARP 2.0 Extends HARP To "Be Better"
After its launch, HARP 1.0 was a hit. It gave homeowners with Fannie Mae- and Freddie Mac-backed mortgages access to a streamline refinance program à la the FHA Streamline Refinance and the VA Streamline Refinance.
In its first three years, close to one million U.S. households used the program. The government, though, decided that this wasn't enough. It wanted HARP to reach even more households; to offer even more relief to struggling homeowners.
From this desire to "do more", HARP 2.0 was born.
HARP 2 didn't make a lot of changes to the HARP 1.0 guidelines. The ones it made, though, were major.
One such change was to grant clemency to HARP 2 lenders in the event that certain loans defaulted. It meant that Chase Mortgage, for example, could HARP refinance a Bank of America loan without worrying about mistakes that Bank of America (or Countrywide) may have made in the original loan file.
This provision made cross-servicer HARP loans possible. Homeowners no longer had to refinance with their current bank or lender.
Another big HARP change was to allow refinanced loans with unlimited loan-to-value. No matter how far your mortgage was underwater, with HARP 2.0, you could be program-eligible. This was especially important in cities such as Las Vegas, Phoenix and Miami where home values dropped faster and farther as compared to other U.S. cities.
Under HARP 2, nearly three times as many homeowners are getting refinance assistance as compared to the original HARP 1.
Click here for HARP mortgage rates.
Arizona : Highest HARP Loans Per Capita
Since HARP's inception, more than 2.7 million U.S. homeowners have used the Obama Refi. Not surprisingly, these closings have concentrated in states where home values the most dropped last decade.
California, for example, leads the nation with 380,000 HARP closing since 2009. This is the 55% more than the state with the second highest number of HARP closings -- Florida.
However, on a per household basis, California's HARP volume fails crack even the Top 10. There has been 1 HARP closing per 32.62 households in California since 2009. The ratio of HARP-to-Household is far higher in states such as Arizona, Nevada and Michigan.
Here's the Top 10 List of HARP Closings Per Capita, By State :
- Arizona : 1 HARP closing for every 17.22 households
- Nevada : 1 HARP closing for every 18.55 households
- Michigan : 1 HARP closing for every 20.92 households
- Minnesota : 1 HARP closing for every 21.30 households
- Washingon : 1 HARP closing for every 22.52 households
- Idaho : 1 HARP closing for every 22.85 households
- Utah : 1 HARP closing for every 22.85 households
- Oregon : 1 HARP closing for every 23.73 households
- Illinois : 1 HARP closing for every 26.42 households
- Georgia : 1 HARP closing for every 26.65 households
The national average is 1 HARP closing for every 41.70 households.
On the other end of the spectrum, the three "bottom" states for HARP queries on a per capita basis are Oklahoma, South Dakota, and North Dakota. Each averages fewer than 1 HARP closing per 200 state-wide households.
HARP 3 Could Extend HARP 2 Benefits
HARP 2 may not be the Home Affordable Refinance Program's last iteration. Soon, the HARP 3 program may pass -- maybe as soon this week. It's unknown what HARP 3 would include but there's an expectation that non-Fannie Mae and non-Freddie Mac mortgages would be included in the plan.
Don't wait for HARP 3 to pass. Check your program eligibility and take a look at today's mortgage rates. The typical HARP homeowner saves more than twenty percent on their payment -- you could save 20 percent, too.