How Much Water Do We Use?
The USGS National Water-Use Science project has documented 60 years of water-use from 1950 to 2010 in an interactive map. Choose a year and pick a category to see how much water your state uses.
Wash. Rinse. Repeat. With every shampoo or load of laundry you may wonder, how much water did I just use?
Now multiply that thought across the nation and add other types of ways to use water, from irrigating crops to sustaining thermoelectric power generation.
The U.S. Geological Survey has been collecting data from States on these and other water-uses since 1950. Spanning 60 years of water-use nationally, this collective data set not only shows variations across the country and throughout time, it lays the framework for an emerging story about our evolving relationship with water.
Then and now
People and industries are changing how they use water as populations
grow, technology advances, and regulations evolve. To assess these
changes, the USGS developed an
interactive data visualization that shows freshwater use by
state every five years from 1950 to 2010. This tool allows users to
discover the most comprehensive national-scale data on water use for
the United States. The USGS compiles and estimates this water-use
information in cooperation with State, Federal, and local agencies.
The estimates are reported by categories including public supply,
irrigation, and thermoelectric power.
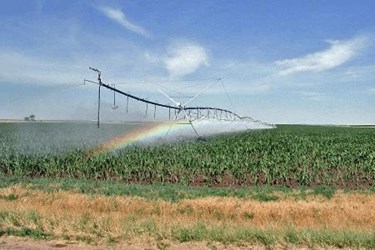
The visualization highlights how differently one half of the country uses water from the other. Water withdrawals for thermoelectric power generation are most prominent in the eastern half of the country while water-use for irrigation is predominant in the west.
Trends within each category are also notable. Water-use associated with public supply increased steadily from 1950 to 2005, then dipped a bit in 2010 despite an increase in population. Industrial water-use for manufacturing dropped from peaks of approximately 39,000 million gallons per day in 1970 and 1980 to approximately 17,000 million gallons per day in 2010, the lowest value seen in the USGS data for this category. The decrease in industrial water-use reflects higher efficiencies in industrial processes and regulations that emphasize water reuse and recycling, as well as economic conditions.
Looking to the future
Understanding how we’ve changed our water usage is essential to help
plan for future water demands. Integrating water-use information
into our understanding of the natural hydrologic cycle strengthens
our ability to provide science-based information to water resource
managers so they can make informed decisions.
“Managing the nation's water resources and planning for its future needs requires a thorough understanding of the amount, source, timing and purpose of water use,” said Ryan Mueller, Executive Director of the Interstate Council on Water Policy. “The USGS recognizes this fundamental need and launched the Water Use Data and Research (WUDR) initiative aimed to improve the accuracy, completeness and sharing of water use data while helping States meet their water use program priorities.”
Through the Water Use and Data Research (WUDR) program, the USGS helps support States efforts to improve water use data collection and estimation techniques. Robust water-use information will allow better, more accurate estimates of water use in the United States and provide information needed to manage water resources and forecast future water-use needs.
The data and software for this visualization are publicly available and open source, in support of the Presidential Memoranda on open data and open source software.
SOURCE: U.S. Geological Survey
http://www.wateronline.com/doc/how-much-water-do-we-use-0001