In urban settings along coastlines around the world, rising seas
threaten infrastructure necessary for local jobs and regional
industries. Roads, bridges, subways, water supplies, oil and gas wells,
power plants, sewage treatment plants, landfills—the list is practically
endless—are all at risk from sea level rise.
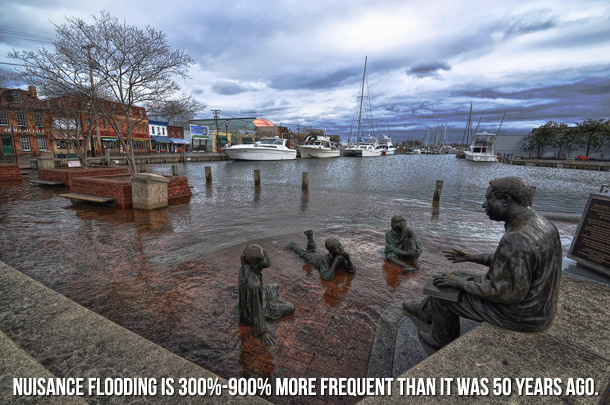
Higher “background” water levels mean that deadly and destructive
storm surges—like those associated with Hurricane Katrina or
“Superstorm” Sandy—push farther inland than they once did. Higher sea
level also means more frequent “nuisance
flooding”—not deadly or dangerous, usually, but still disruptive and
expensive.
In the natural world, rising sea level creates stress on coastal
ecosystems that provide recreation, protection from storms, and habitat
for fish and wildlife, including commercially valuable fisheries. As
seas rise, saltwater is also intruding into freshwater aquifers, many of
which sustain municipal and agricultural water supplies and natural
ecosystems.
Sea level is rising for two main reasons: glaciers and ice sheets are
melting and adding water to the ocean and the volume of the ocean is
expanding as the water warms. A third, much smaller contributor to sea
level rise is a decline in water storage on land—aquifers, lakes and
reservoirs, rivers, soil moisture—mostly as a result of groundwater
pumping, which has shifted water from aquifers to the ocean.
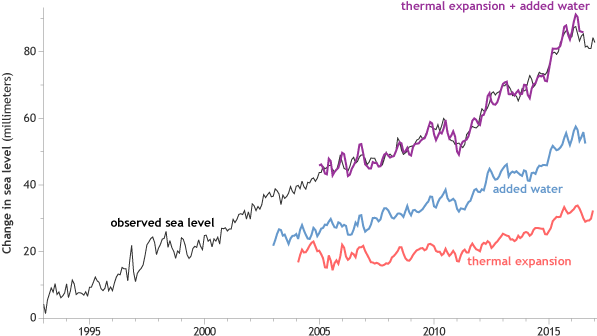
From the 1970s up through the last decade, melting and thermal
expansion were contributing roughly equally to the observed sea level
rise. But the melting of glaciers and ice sheets has accelerated, and
over the past decade, the amount of sea level rise due to melting—with a
small addition from groundwater transfer and other water storage
shifts—has been nearly twice the amount of sea level rise due to
thermal expansion.
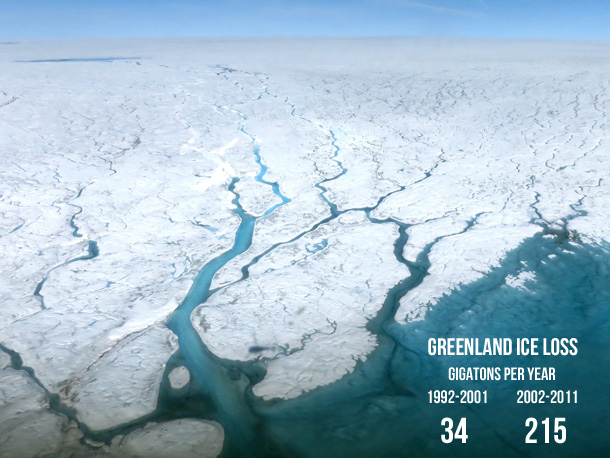
Glacier mass loss accelerated from 226 gigatons/year between 1971
and 2009 to 275 gigatons/year between 1993 and 2009. Ice loss from
the Greenland Ice Sheet increased six-fold, from 34 gigatons/year
between 1992-2001 to 215 gigatons/year between 2002 and 2011.
Antarctic ice loss more than quadrupled, from 30 gigatons/year
between 1992 and 2001 to 147 gigatons/year from 2002 to 2011.
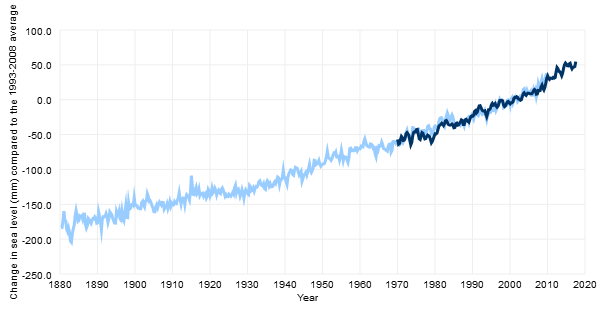
The pace of global sea level rise doubled from 1.7 mm/year
throughout most of the twentieth century to 3.4 mm/year since
1993.
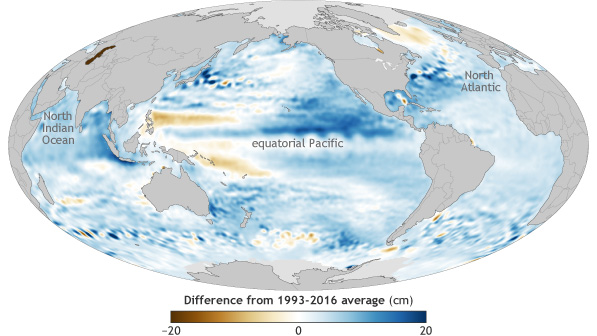
Sea level rise
at specific locations may be more or less than the global
average due to local factors: subsidence, upstream flood control,
erosion, regional ocean currents, and whether the land is still
rebounding from the compressive weight of Ice Age glaciers.
Measuring sea level
Sea level is measured by two main methods:
tide gauges and satellite laser altimeters. Tide gauge stations
from around the world have measured the daily high and low tides for
more than a century, using a variety of manual and automatic
sensors. Using data from scores of stations around the world,
scientists can calculate a global average and adjust it for seasonal
differences.
Since the early 1990s, sea level has been measured from space
using laser altimeters, which determine the height of the sea
surface by measuring the return speed and intensity of a laser pulse
directed at the ocean. The higher the sea level, the faster and
stronger the return signal is.
To estimate how much of the observed sea level rise is due to
thermal expansion, scientists measure sea surface temperature using
moored and drifting buoys, satellites, and water samples collected
by ships. Temperatures in the upper half of the ocean volume are
measured by a global fleet of
aquatic robots.
To estimate how much of the increase in sea level is due to
actual mass transfer—the movement of water from land to
ocean—scientists rely on a combination of direct measurements of
melt rate and glacier elevation made during field surveys, and
satellite-based measurements of tiny shifts in Earth’s gravity
field. When water shifts from land to ocean, the increase in mass
increases the strength of gravity over oceans by a small amount.
From these gravity shifts, scientists estimate the amount of added
water.
Future sea level rise
As global temperatures continue to warm, sea level will continue
to rise. How much it will rise depends mostly on the rate of future
carbon dioxide emissions and future global warming. How fast it will
rise depends mostly on the rate of glacier and ice sheet melting.
The pace of sea level rise accelerated beginning in the 1990s,
coinciding with acceleration in glacier and ice sheet melting.
However, it’s uncertain whether that acceleration will continue,
driving faster and faster sea level rise, or whether internal
glacier and ice sheet dynamics (not to mention natural climate
variability) will lead to “pulses” of accelerated melting
interrupted by slow downs.
In 2012, at the request of the U.S. Climate Change Science
Program, NOAA scientists
conducted a review of the research on global sea level rise
projections, and concluded that there is very high confidence
(greater than 90% chance) that global mean sea level will rise at
least 8 inches (0.2 meter) but no more than 6.6 feet (2.0 meters) by
2100.
About the data used in the interactive graph
The early part of the time series shown in the graph above comes
from the
sea level group of CSIRO (Commonwealth Scientific and Industrial
Research Organisation), Australia's national science agency. The
more recent part of the time series is from the University of Hawaii
Sea Level Center. It is based on a weighted average of 373 global
tide gauge records collected by the U.S. National Ocean Service,
UHSLC, and partner agencies worldwide. The weights for each gauge in
the global mean are determined by a cluster analysis that groups
gauges from locations where sea level tends to vary in the same way.
This prevents over-emphasizing regions where there are many tide
gauges located in close proximity. The values are shown as change in
sea level in millimeters compared to the 1993-2008 average.
References
Church, J. A., & White, N. J. (2011). Sea-Level Rise from the
Late 19th to the Early 21st Century. Surveys in Geophysics, 32(4-5),
585–602.
http://doi.org/10.1007/s10712-011-9119-1
IPCC. (2013). Summary for Policymakers. In: Climate Change 2013:
The Physical Science Basis. Contribution of Working Group I to the
Fifth Assessment Report of the Intergovernmental Panel on Climate
Change [Stocker,T.F., D. Qin, G.-K. Plattner, M. Tignor, S.K. Allen,
J. Boschung, A. Nauels, Y. Xia, V. Bex and P.M. Midgley (eds.)].
Cambridge University Press, Cambridge, United Kingdom and New York,
NY, USA. [online]
http://www.ipcc.ch/pdf/assessment-report/ar5/wg1/WG1AR5_SPM_FINAL.pdf.
Accessed November 2, 2015.
Leuliette, E. (2014). The budget of recent global sea level rise:
1995-2013. Published by the National Oceanic and Atmospheric
Administration. [online pdf]
http://www.star.nesdis.noaa.gov/sod/lsa/SeaLevelRise/documents/NOAA_NESD....
Accessed November 2, 2015.
Merrifield, M.A., P. Thompson, E. Leuliette, G.T. Mitchum, D.P.
Chambers, S. Jevrejeva, R.S. Nerem, M. Menéndez, W. Sweet, B.D.
Hamlington, and J.J. Marra. (2014). [Global Ocean] Sea level
variability and change [in “State of the Climate in 2014”], Bulletin
of the American Meteorological Society (BAMS), 96 (7), S82-S85.
Parris, A., P. Bromirski, V. Burkett, D. Cayan, M. Culver,
J. Hall, R. Horton, K. Knuuti, R. Moss, J. Obeysekera, A. Sallenger,
and J. Weiss. (2012). Global Sea Level Rise Scenarios for the US
National Climate Assessment. NOAA Tech Memo OAR CPO-1. 37 pp.
[online]
http://cpo.noaa.gov/sites/cpo/Reports/2012/NOAA_SLR_r3.pdf.
Accessed November 2, 2015.
Pelto, M.S. (2015). [Global Climate] Alpine Glaciers [in
“State of the Climate in 2014”]. Bulletin of the American
Meteorological Society (BAMS), 96 (7), S19-S20.
Sweet, W., and Marra, J. (2014). 2014 State of nuisance tidal
flooding. Published by the National Oceanic and Atmospheric
Administration. [online]
http://www1.ncdc.noaa.gov/pub/data/cmb/special-reports/sweet-marra-nuisa....
Accessed November 2, 2015.
More sea level data and information from NOAA and partners
Global Ocean Heat and Salt Content page at NCEI
Tides and Currents Sea Level Trends page at the National Ocean
Service
Digital Coast Sea Level Rise Viewer at the Coastal Services
Center
Coastal Flood Risk page at the U.S. Climate Resilience Toolkit
https://www.climate.gov/news-features/understanding-climate/climate-change-global-sea-level