Temperatures measured on land and at sea for more
than a century show that Earth's globally averaged
surface temperature is rising. Since 1970, global
surface temperature rose at an average rate of about
0.17°C (around 0.3° Fahrenheit) per decade—more than
twice as fast as the 0.07°C per decade increase observed
for the entire period of recorded observations
(1880-2015). The average global temperature for 2016 was
0.94°C (1.69°F) above the 20th century
average of 13.9°C (57.0°F), surpassing the previous
record warmth of 2015 by 0.04°C (0.07°F).
Change over time
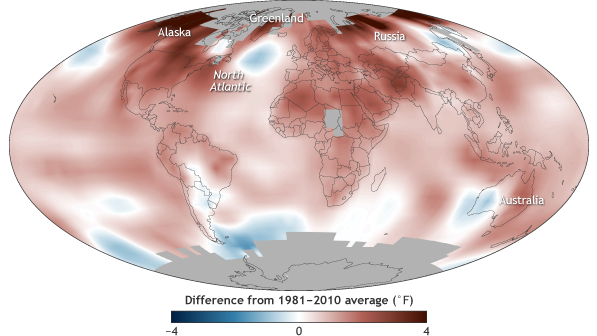
Though warming has not been uniform across the
planet, the upward trend in the globally averaged
temperature shows that more areas are warming than
cooling. Since 1880, surface temperature has risen at an
average pace of 0.13°F (0.07°C) every 10 years for a net
warming of 1.69°F (0.94°C) through 2016. Over this
137-year period, average temperature over land areas has
warmed faster than ocean temperatures:
0.18°F (0.10°C) per decade compared to 0.11°F
(0.06°C) per decade. The last year with a
temperature cooler than the twentieth-century average
was 1976.
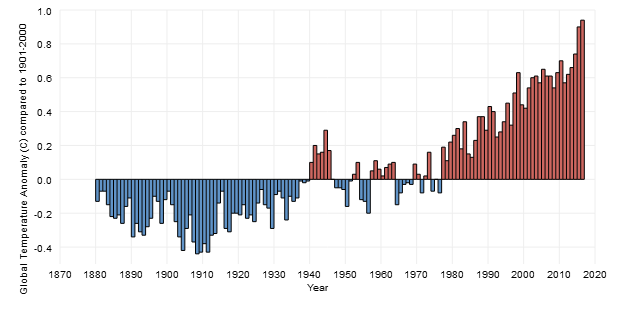
History of global surface
temperature since 1880
Explore this interactive graph:
Click and drag to display different parts of the graph. To squeeze or
stretch the graph in either direction, hold your Shift key down, then
click and drag. The graph shows average annual global temperatures since
1880 (source
data) compared to the long-term average (1901-2000). The zero line
represents the long-term average temperature for the whole planet; blue
and red bars show the difference above or below average for each year.
According to the
official 2016 global report from NOAA's National Centers for
Environmental Information,
[2016] marks the fifth time in the 21st century a new
record high annual temperature has been set (along with 2005, 2010,
2014, and 2015) and also marks the 40th consecutive year
(since 1977) that the annual temperature has been above the 20th century
average. To date, all 16 years of the 21st century rank
among the seventeen warmest on record (1998 is currently the eighth
warmest.) The five warmest years have all occurred since 2010.
By 2020, models project that global surface temperature will be more
than 0.5°C (0.9°F) warmer than the 1986-2005 average, regardless of
which carbon dioxide emissions pathway the world follows. This
similarity in temperatures regardless of total emissions is a short-term
phenomenon: it reflects the tremendous inertia of Earth's vast oceans.
The high heat capacity of water means that ocean temperature doesn't
react instantly to the increased heat being trapped by greenhouse
gases. By 2030, however, the heating imbalance caused by greenhouse
gases begins to overcome the oceans' thermal inertia, and projected
temperature pathways begin to diverge, with unchecked carbon dioxide
emissions likely leading to several additional degrees of warming by the
end of the century.
About surface temperature
The concept of an average temperature for the entire globe may seem
odd. After all, at this very moment, the highest and lowest temperatures
on Earth are likely more than 100°F (55°C) apart. Temperatures vary from
night to day and between seasonal extremes in the Northern and Southern
Hemispheres. This means that some parts of Earth are quite cold while
other parts are downright hot. To speak of the "average" temperature,
then, may seem like nonsense. However, the concept of a global average
temperature is convenient for detecting and tracking changes in Earth's
energy budget—how much sunlight Earth absorbs minus how much it radiates
to space as heat—over time.
To calculate a global average temperature, scientists begin with
temperature measurements taken at locations around the globe. Because
their goal is to track changes in temperature, measurements are
converted from absolute temperature readings to temperature
anomalies—the difference between the observed temperature and the
long-term average temperature for each location and date.
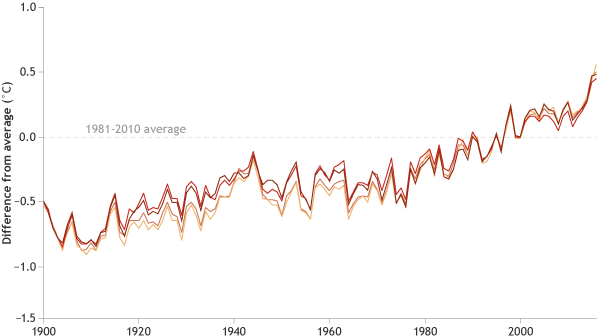
Multiple independent research groups across the world perform their own
analysis of the surface temperature data, and they all show a similar
upward trend.
Across inaccessible areas that have few measurements, scientists use
surrounding temperatures and other information to estimate the missing
values. Each value is then used to calculate a global temperature
average. This process provides a consistent, reliable method for
monitoring changes in Earth's surface temperature over time. Read more
about how the global surface temperature record is built in our
Climate Data Primer.
References
NOAA National Centers for Environmental Information, State of the
Climate: Global Analysis for Annual 2016, published online January 2017,
retrieved on September 11, 2017 from
https://www.ncdc.noaa.gov/sotc/global/201613.
IPCC,
2013:
Summary for Policymakers. In: Climate Change 2013: The Physical
Science Basis. Contribution of Working Group 1 to the 5th Assessment
Report of the Intergovernmental Panel on Climate Change [Stocker, T.F.,
D. Qin, G.-K. Plattner, M. Tignor, S.K. Allen, J. Boschung, A. Nauels,
Y. Xia, V. Bex and P.M. Midgley (eds.)]. Cambridge University Press,
Cambridge, United Kingdom and New York, NY, USA.
R. J. H. Dunn, D. F. Hurst, N. Gobron, and K. M. Willett, Eds., 2017:
Global Climate [in “State of the Climate in 2016”]. Bull. Amer. Meteor.
Soc., 98 (8), S5–S62, doi:10.1175/2017BAMSStateoftheClimate.1.
Interactive graph data
Annual global temperature anomalies for land and ocean combined,
expressed as departures from the 1901-2000 average. National Climatic
Data Center.
https://www.climate.gov/news-features/understanding-climate/climate-change-global-temperature
|