This is an in-depth article on the cycles of climate change. The intent for this extensive essay is to provide those that are ready with a deeper, science-based analysis on the issue.
What Is Going On!
There is overwhelming evidence that global warming has happened. The question addressed in this article is, in 2017 (after 58 peer reviewed papers were published in the first six months of the year clearly indicating that we’re no longer in a global warming cycle) is global warming still happening or does the science now suggest that we are moving into a cycle of global cooling… and, if so… what to do? My interest in this question about what to do comes from my function as a large organic gardener focused on sustainability, as a scientific researcher, as a holistic physician, and as a spiritual teacher. In order to address this important question and issue, I’ve done the unthinkable; I’ve popped outside of the limiting belief system of the “politically correct” Matrix of what the media, elite politicians in both parties, and government funded scientists are presently saying about global warming, a.k.a. climate change. In other words, I’ve done my own research on the issue. In this scientific research endeavor, I was delighted to find that there is a growing number of climate scientists who are assessing and understanding these issues of “climate change” with the same conclusions that my primary research approach has lead me to. What I’ve discovered, to my surprise, and beyond any political position or party, none of which I am interested in nor support, is that for hundreds of thousands of years, the earth has gone through a variety of global cyclic warmings and coolings. These cycles of warming and cooling have existed for thousands of years before the Industrial Age. Although the reasons for cycles of climate change are multifactoral, they are primarily related to the number of sunspot cycles decreasing and increasing over time. The small amount of the actual temperature change (+ or – 1 degree Celsius) for this current warming period that has ended in 1998, that is approximately normal for the warming cycles that have occurred in previous warming cycles. It is illuminating to note that the benefits of warming cycles seem to exceed their detriments for the world population. In other words, global warming cycles basically benefit the world population and food production, while global cooling and/or mini ice age cycles damage human culture and threaten survival of the species.
In reviewing the various data analysis approaches, there seem to be two basic approaches being used today: 1) computer projection models (which can be subtly biased or grossly manipulated according to their input), such as used by the UN scientists of the IPCC (Intergovernmental Panel on Climate Change) and Mr. Gore; and 2) historical observation models, based on actual global temperature, sunspot measurements, earth/sun gravitational distance patterns, ocean water levels, ice core analysis, and patterns of temperature change in global surface and water over thousands of years. With the Sun’s surface becoming progressively quiet (less sunspots) since 1998, the monthly sunspot patterns and weather at this time in history (2017) are most similar to those of 1797, a time preceding the Dalton Minimum global cooling temperatures of 1793-1823, which was a mini ice age. The historical science of global climate change reveals itself in relative cyclic macro patterns, rather than a linear, one time pattern, such as Gore’s proposed linear pattern of increasing global warming, secondary to Industrial Age influences.
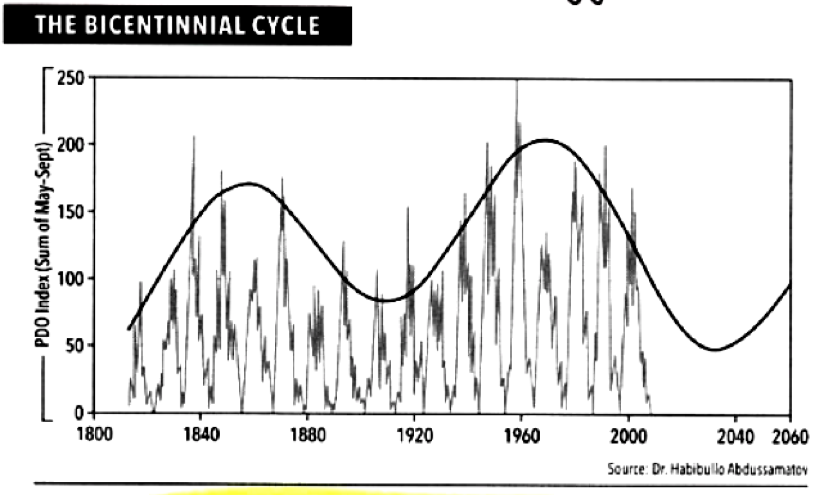
The Miklankovitch (M.) theory (also known as De Vries, Suess, or Gleissberg Cycles) describes the cyclic variations of Earth’s orbital and rotational motion parameters in cycles of up to 120,000 years. However, the M. theory can’t help us understand the shorter climate cycles, like the ones lasting from 2,000 to 10,000 years. Nor does it consider the “cycles of little ice epochs” (ranging from 2,200 to 2,400 years in duration), or climate oscillation patterns of 206 years. The Bicentennial Cycles (with durations of 206 years) have normal global temperature changes of about 0.5 to 1 degree Celsius, such as the global warming cycle we have just passed through. Currently there’s much evidence that the 2,200- to 2,400-year cycles and the other relatively shorter climatic cycles are all caused primarily by sunspots and the sun’s and earth’s slight movements toward and away from each other. It is documented that these cycles existed thousands of years before the Industrial Age and are fundamentally independent of the Industrial Age. According to historical cyclic observation, it appears that Industrial Age manmade CO2, on which the “Gore” theory is based” has a negligible impact on both global warming and cooling cycles. On a psycho-spiritual level, the Gore theory is faulty not only because its predictions have not come true, but it’s deeply egocentric, and, thus, not in harmony with the cycles of God’s natural creation.
An increasing group of astrophysicists, geophysicists, and paleoclimatologists have studied the role of the sun in climate change. This includes the role of number of sunspots, as well as variations in distances from the earth over time. Sunspots, depending on whether increasing or decreasing correlate with periods of global warming and global cooling respectively. Since 1998, a relatively long-term downward trend in solar sunspot activity has already started, and it will inevitably cause a corresponding climate cooling similar to the Dalton Minimum of extreme global cooling temperatures that occurred around the mini ice age of 1815. The cooling may be as much as 0.7 to 0.8 degrees C. Some project, based on historical evidence of previous mini ice ages, that this drop may come on suddenly rather than over time. During the past 110,000 years there have been at least twenty abrupt climate changes. Historical records show us that abrupt climate change is not only possible… it is the normal state of affairs. The overall historical cyclic data strongly suggests that the beneficial growth producing cycle of the present global warming has ended and a new and destructive cold climate is beginning. Members of the Russian Academy of Sciences have stated openly in as early as 2007 that we are entering a new “Little Ice Age” (LIA). This ice age discussion and prediction is the main point and concern of this essay.
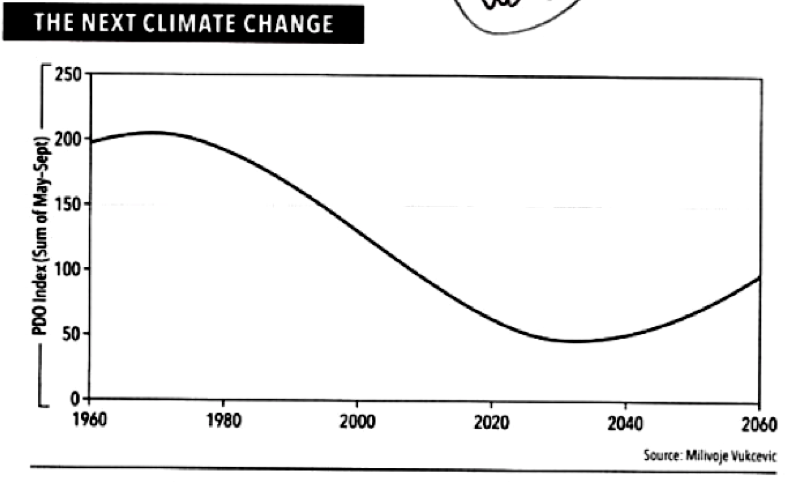
The well-documented scientific analysis of the outstanding intellect and scientist, John L. Casey, who worked in high levels at NASA, has documented in his book, Dark Winter (1), a useful overview, in convincing detail, of the cycle theory of global warming and cooling. John Casey has developed a descriptive theory on this that he calls Relational Cycle (RC). RC theory postulates climatic and geological manifestations on the earth are primarily the result of solar changes and sunspots. The RC theory, which has been about 90% accurate, contrary to the theory of manmade global warming (otherwise known as anthropogenic global warming or AGW), aka, climate change, based on human greenhouse gas emissions. Contrary to the RC model’s accuracy, every projection of the Gore AGW has been consistently disproven and inaccurate. The key is the RC (Relational Cycle) theory is based on historical data cycles, rather than linear manmade global warming computer models. Casey’s Relational Cycle postulates three basic points: 1) Global warming ended in 1998. 2) The sun hibernates about every 206 years. This solar hibernation is marked by a historic and cyclic reduction in the sun’s energy output and number of sunspots, resulting in a relatively long-term drop in human lifespan in the earth’s average temperature. 3) RC theory predicts a global cooling (mini ice age) climate change beginning around 2019-20, peaking in 2030 and moving toward warming again in 2053. It is this “mini ice age” cooling prediction that could be disastrous for the unprepared and is the main teaching point of this essay. Based on RC theory and the observations of a growing number of climate scientists around the world, it would appear that the most reliable source for climate change prediction is the number of sunspots varying in 206-year Bicentennial Cycles. The last solar minimum, marked by a low number of sunspots, occurred between 1793 and 1830. That solar minimum included 1816, otherwise known as the “year without a summer”. This was close to the time that Napoleon, without consulting his “local climatologist”, attempted to invade Russia during the coldest part of this cycle (the Dalton Minimum), around 1812-1816, and, consequently, was literally frozen out. It is estimated that 400,000 of his 600,000-man army died from the cold and starvation.
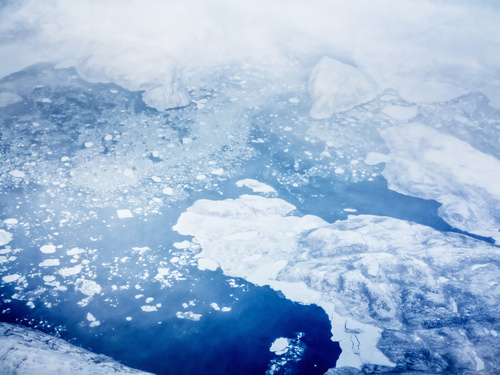
The following graph (fig. A) outlines the variation of sunspot numbers from the year 1600 to the year 2000. Fewer sunspots are directly associated with reduced global temperatures. The Dalton (mini ice age occurrence) Minimum in the early 1800s is associated with the lowest number of sunspots. The global cooling from 1650-1700, called the Maunder Minimum, is also directly related to a lower number of sunspots.
 (fig.
A)
(fig.
A)
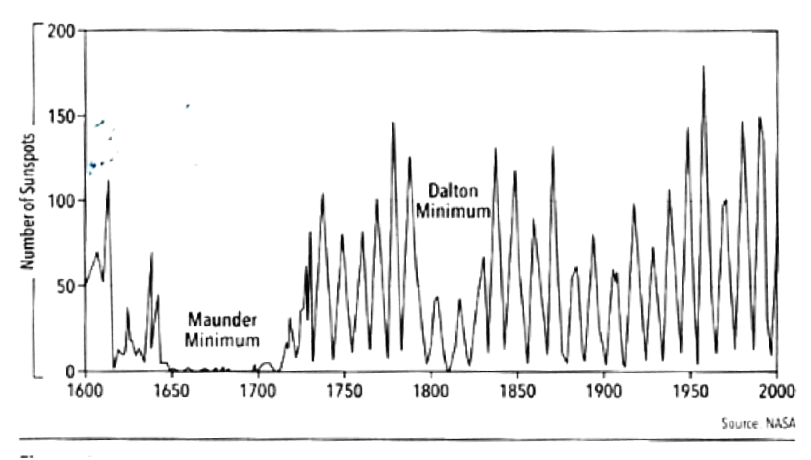
This next sunspot graph (fig. B) illustrates the changing cycle of sunspots over time preceding the mini ice age of 1793-1830.
 (fig
B)
(fig
B)
Obviously, none of these climate changes, either global warming cycle in 1780 and cooling in 1815, had anything to do with industrial influences as there was no significant industrial pollution at those times in history.
Presently there’s serious and increasing scientific convincing verification for the validity of global historical cyclic approach to understanding the global cooling and warming cycles we’re presently living in. This is important to understand that this predicted cooling cycle (2019-2053) is one marked by a decline in warming data and a rise in cooling evidence data and confirming scientific peer reviewed papers. For example, John Casey found 73 researchers in over 40 peer-reviewed papers or publications that supported all or part of the elements of his RC theory, and consequently the high probability of a soon to be global cooling cycle. This included 16 scientists who predicted this coming cold era. Additionally, 18 researchers in 11 scientific papers supported the existence of the Centennial Cycles; 17 researchers in 8 papers supported Bicentennial Cycles theory; 11 researchers in 8 papers supported both cycles found together; 9 researchers in 7 papers supported temperature correlations with solar sunspot minimums; and 12 researchers in 11 papers who have predicted the next solar minimum (coming cold era). The point is that the basis of the RC theory predictions of global temperature cycles and the coming global cooling evolves from a variety of extensive climate research efforts by independent researchers.
A more recent confirmation of the impending cooling cycle was released on January 25th, 2011 when NASA released data that confirmed solar hibernation (dramatic decrease in sunspots) was happening as predicted by John Casey. In Press Release 1-2011, the SSRC (Space and Science Research Corporation) announced that the 4-year effort of its director, John Casey, to convince the scientific community, the US government, the media, and the public that a solar hibernation is coming was substantiated. The expected approximately 34-year global cold era that follows these solar hibernations was also validated by their data. This was further validated on February 4th, 2011, when the SSRC issued Press Release 2-2011, which indicated that the next phase of global cooling had begun, marked by a record drop in Earth’s ocean temperatures. Relying on NASA and NOAA (National Oceanic and Atmospheric Administration) satellite measurements and processed by other government-contracted organizations, the SSRC press release made note of the new record steep drop in ocean temperatures supporting its May 10th, 2010 forecast for a record global temperature reduction. In addition, the Hadley Centre, University of Alabama in Huntsville (UAH), and Remote Sensing Systems (RSS) had all published their measurements of the significant drop in Earth’s temperatures in early 2008. It was significant that each organization established on its own that Earth was gone through a historic drop in average temperatures between January 2007 and mid-2008. UAH observed a drop of 0.588 C between January 2007 and January 2008. The Hadley Centre, over the same period, also reported a drop of 0.595 C.
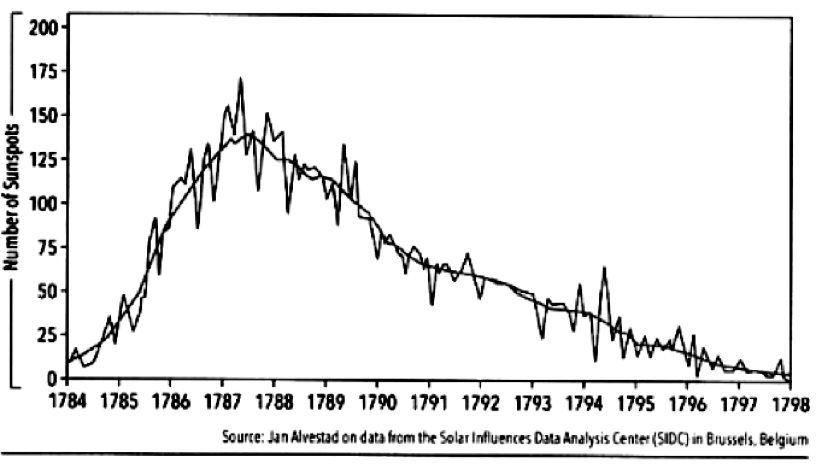
The overall point is, again, we are in the beginning of a solar hibernation, which is proceeding in almost exact parallel to the solar hibernation cycle that occurred between 1793 and 1830, associated with global cooling and mini ice age. There is a strong cyclic historical data suggestion that this present cooling cycle may begin more actively as early as 2019. This beginning solar hibernation movement was recently verified using sunspot measurements. Some historical data suggests that mini ice age cycles can sometimes happen very quickly, which could possibly suggest this transition to global cooling or mini ice age may happen so rapidly that without appropriate preparation it could threaten the survival of many people on the planet. Below is a chart (fig. C) showing a ten-year trend in global cooling trend.
 (fig.
C)
(fig.
C)
It’s worthwhile to review worldwide weather reports and news headlines giving anecdotal evidence of global cooling to give some perspective to support that this is actually happening. These articles are indications of the cooling is happening all around us, yet, it’s hard to notice if one isn’t looking.
1. On January 8th, 2010, Bismarck, North Dakota, had a
temperature of -38F with a wind chill of -50F (as reported by
Houston radio WFVB); this level of sub-zero temperatures are
normally found at the Arctic and Antarctic poles regions.
2. On January 11th, 2010, Miami, Florida, had a record cold
temperature of 37F, breaking an 83-year-old record from 1927 (as
reported by KUHF and NPR).
3. On January 21st, 2011, International Falls, Minnesota, set a new
record cold of -46F, beating the old record of -41F (1954) (as
reported on The Weather Channel).
4. In 2011, Sweden reported its coldest weather in a hundred years.
5. Polish weather experts have predicted that Europe and Russia will
have to endure their coldest winters in 1,000 years.
6. New York Times (5/21/1975) – Scientists Ponder Why World’s
Climate Is Changing; a Major Cooling Widely Considered to Be
Inevitable (2)
7. Harper’s (9/1958) – The Coming Ice Age (cover story)
8. China Daily (1/22/2010) – Sea ice causes fishery loss (3)
9. BBC (7/12/2009) Children die in harsh Peru winter (4)
10. Pravda.ru (11/1/2009) – Earth on the Brink of an Ice Age (5)
11. The Register (8/15/2008) – Arctic ice refuses to melt as ordered
(6)
12. The Express (2/18/2008) – Global warming? It’s the coldest
winter in decades (7)
On February 14th, 2011 NASA’s ocean temperature study showed declining ocean temperatures. Contrary to fake news and Al Gore’s claims that it’s melting, Antarctica has gained ice at the rate of 112 billion tons of ice every year from 1992 to 2001, which slowed to 82 billion tons of ice gain per year between 2003 and 2008. Even the UN’s IPCC has accepted Antarctica’s billion tons of ice gain data as valid, and has stated that it will continue to gain ice into the foreseeable future. Obviously, this actual reality doesn’t support an ongoing AGW theory or predictions, all of which have not been proven true.
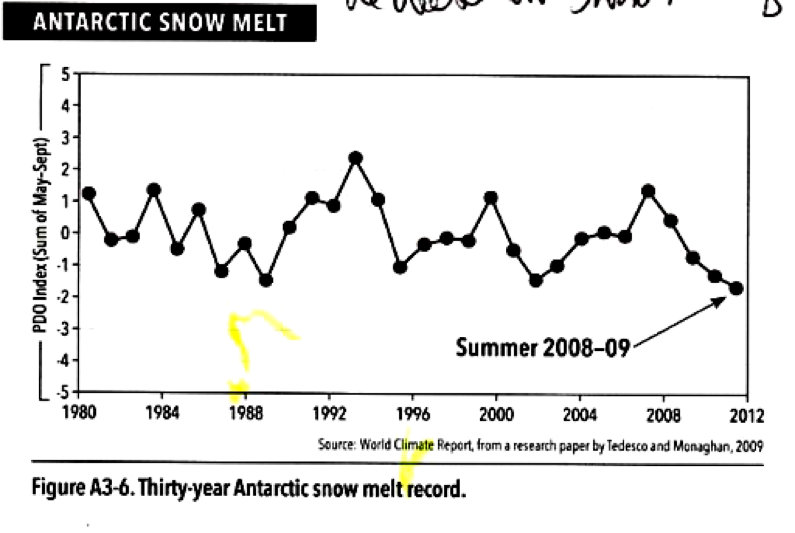
The chart below (fig. D) shows actual decreases in Antarctica’s snow melt, which obviously contradicts the AGW predictions. Decreasing melt as shown above suggests a global cooling effect.
 (fig.
D)
(fig.
D)
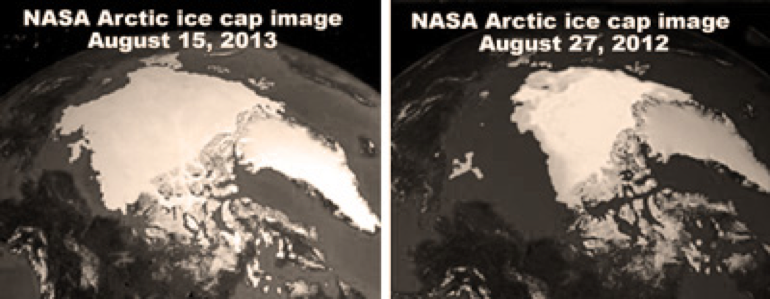
Greenland’s glacial ice sheet is also stable and growing, contrary to AGW consistently inaccurate predictions. The Arctic ice cap images (fig. E) also suggest a global cooling effect, as there is an obvious increase in the Arctic ice cap size from 2012 to 2013. (2012 is the one on the right, and 2013 is on the left.)
 (fig.
E)
(fig.
E)
In a 2005 article in the journal Glaciology, Dr. H. Jay Zwally reported that the Greenland ice sheet had grown between 1992 and 2002 by 11 billion tons each year (plus or minus 3 billion tons per year). In 2005 Greenland had undergone a net significant increase in its ice sheet for at least 16 years. As usual it’s far more accurate to look at actual “clinical” picture rather than basing our numbers on computer prediction models. A theory is only as valid as its predictions. All predictions made by the AGW theory have been proven to be inaccurate, and, from a scientific method perspective, one must conclude that so is the theory that makes them. Back in 2003, climate scientists, Edward Hanna, of the University of Sheffield’s Department of Geography, and John Cappelen, of the Danish Meteorological Institute in Copenhagen, Denmark, stated, “The Greenland air temperature data showed a cooling of 1.29C over the period of study (1958-2001).” They reported that the warmest period in Greenland occurred before World War II, before the last 70 years of massive global industrialization and the emission of most anthropogenic (manmade) greenhouse gasses. Their data obviously challenges the validity of the AGW theory.
The below graph (fig. F) shows the Pacific Ocean bringing cold water to the west coast (indicated by PDO levels). A low PDO trend is associated with the onset of a global cooling cycle.
 (fig
F)
(fig
F)
Contrary to NOAA’s projections that the Arctic would be ice free and Al Gore’s prediction in 2008 that polar ice caps would melt in 5 years, Arctic summer ice has actually increased by 409 square miles (26%) since 2007. This is an indisputable scientific observation, again, not based on computer generated models, but on measurable physical facts of the earth and ocean. Further supporting this reality of increasing Arctic ice is that polar bear population, predicted to die out by the AWG is increasing. Polar bear numbers have actually grown in number from 5,000 to 20,000-32,000. These are the actual “bear” facts that disprove the computer generated AGW models.
 (fig.
G)
(fig.
G)
In looking at Earth’s cycles of warming and cooling, RC theory is proving itself to be accurate whereas AGW theory has not yet shown itself to be an accurate measure of climate change on any level. A substantial amount of research now exists showing the sun and its sunspots to be the primary catalyst for all Earth’s climate cycles over thousands of years, including our most recent cycle of global warming and the impending cycle of global cooling. Climate models using sunspot activity as the primary causal energy seem to be the only reliable prediction for these alternating cycles. The above chart (fig. G) shows more evidence of cycles in general and the timing of when we will be entering a cold era.
Although this essay is far less about global warming than to give warning about the coming global cooling mini ice age cycle, I feel it’s responsible and critical to both acknowledge that we’ve indeed been in a cycle of global warming. In 1998, we’ve moved out of the global warming cycle. My message is that we need to prepare for the usually serious events associated with global cooling or potentially a mini ice age. Further support of this global cooling cycle projection, occurring in early 2017, when over 58 scientific papers with over 80 graphs from peer reviewed journals were published. They all point out, through different research finding perspectives, that AGW is an illusion of science that has not been validated by non-politically-based science. Contributors of these 2017 peer reviewed scientific papers include scientists from China, Russia, US, and Italy all looking at climate change from the perspectives of their regions and timescales. Their research disproves the AGW theory with actual hard science. Contrary to these 58 peer reviewed papers, there is no peer reviewed evidence to support AGW theory. There is a growing and significant number of scientists who do not support Gore’s AWG theory. For example, the Global Warming Petition Project has, to date, garnered the signatures of 31,487 American scientists who agree that no evidence shows human beings are heating our planet’s atmosphere at a level that significantly impacts global temperatures. Two of the most important petition signers are Edward Teller, “the father of the hydrogen bomb”, and Dr. Reid A. Bryson, universally recognized as “the father of modern climatology”. In testimony before the US Senate in 2007, they, along with other top scientists, rejected the AGW climate change meme by stating: “All this argument is the temperature going up or not, it’s absurd. Of course it’s going up. It has gone up since the early 1800s, before the Industrial Revolution, because we’re coming out of the Little Ice Age, not because we’re putting more carbon dioxide into the air.” Another petition by scientists trying to tell the world that the political and media portrayal of global warming is false was put forward in the Heidelberg Appeal in 1992. It has more than 4,000 signatories, including 72 Nobel Prize winners, from 106 countries who have signed it.
This huge number of scientists (31,487 who signed the Global Warming Petition Project) and the Heidelberg Appeal of 400 scientists stands in stark contrast against the distorted “97% consensus” of scientists on global warming theory (AGW). This seriously misleading 97% number came from a survey conducted for a thesis. This “consensus percentage” derives from a survey conducted for a thesis by M R K Zimmerman. A survey was sent to 10,257 international scientists of which 3,146 responded. The researchers selected only 79 from their sample for further interview. Not content with such a distorted sample, the researchers then selected 77 from this sample and declared them “experts.” Of those 77 scientists, two were excluded from a second supplementary question. So, 75 out of 77 made it through to the final round, and 97.4% of this limited, pre-selected number were found to agree with “the consensus”. That’s where the misleading 97% figure comes from. These 75 scientists make up .0011% of the 7 million (according to the UN) full time employed research and development scientists. This meager, pre-selected 75 scientist group is certainly not a counterweight to 31,487 scientists saying there is no evidence. This “97% consensus” figure is disingenuous and misleading. In support of the wisdom of the American public, according to polls, only 27% of the US population currently believes there is a scientific consensus on global warming.
Making this situation worse for the AGW theorists are whistleblower claims by leading scientists that official and other governmental climate data has actually been altered to create a global warming illusion. The Telegraph’s Christopher Booker (Britain) writes that climate data from stations in South America have been adjusted since the 1950s to give the impression that the earth’s temperature is rising more than the original data showed. Booker cites Paul Homewood’s Not a Lot of People Know That blog where Homewood compares raw data with adjusted temperatures to show the graph trend was reversed from a cooling trend to a warming one. Homewood checked the data on three weather stations in Paraguay and found that all three had their initial raw readings adjusted to show lower temperatures in the 1950s and higher temperatures into the 2000s. In looking at stations in the Arctic, between Canada and Siberia, Booker reports. “Again, in nearly every case, the same one-way adjustments have been made, to show warming up to 1 degree C, or more, higher than was indicated by the data that was actually recorded”. Another scientific report was just released in the United States titled, “On the Validity of NOAA, NASA and Hadley CRU Global Average Surface Temperature Data & The Validity of EPA’s CO2 Endangerment Finding”. This report states that after being peer reviewed by administrators, scientists and researchers from the US Environmental Protection Agency, Massachusetts Institute of Technology, and several of America’s leading universities, the data used to support AWG climate change is “complete bunk”. (8) Although it is unfortunately undermining for our faith in “science”, it is fortuitous that both NASA and the NOAA have been caught red-handed by truthful, ethical climatologists of attempting to alter historical temperature data to produce a “climate change narrative” that is not aligned with the reality of nature. We now know that historical temperature data for the continental United States were deliberately altered by NASA and NOAA scientists in a politically-motivated attempt to rewrite history and claim global warming. The untampered data actually shows that we are in a cooling trend, not a warming trend. This story is starting to break worldwide right now across the media, with The Telegraph now reporting, “NOAA’s US Historical Climatology Network (USHCN) has been ‘adjusting’ its record by replacing real temperatures with data ‘fabricated’ by computer models.”
The European Foundation in 2012 released an insightful paper that includes one hundred reasons why climate change is natural and not man-made. (9) Below are some of the more salient points:
• There is “no real scientific proof”
that the current warming is caused by the rise of greenhouse gases
from man’s activity.
• Man-made carbon dioxide emissions throughout human history
constitute less than 0.00022 % of the total naturally emitted from
the mantle of the earth during geological history.
• After World War II, there was a huge surge in recorded CO2
emissions but global temperatures fell for four decades after 1940.
• Throughout the Earth’s history, temperatures have often been
warmer than now and CO2 levels have often been higher [at some
periods] more than ten times as high.
• Significant changes in climate [cycles] have continually occurred
throughout geologic time.
• The 0.7C increase in the average global temperature over the last
hundred years is entirely consistent with well-established,
long-term, natural climate trends.
• The IPCC theory is driven by just 60 scientists and favorable
reviewers not the 4,000 usually cited.
• Politicians and activists claim rising sea levels are a direct
cause of global warming but sea levels rates have been increasing
steadily since the last [major] ice age 10,000 ago [without any
recent acceleration since 1850, when it began being accurately
monitored in New York].
• Philip Stott, Emeritus Professor of Biogeography at the School of
Oriental and African Studies in London says climate change is too
complicated [and multi-factoral] to be caused by just one factor,
whether CO2 or clouds.
• Professor Plimer, Professor of Geology and Earth Sciences at the
University of Adelaide, stated that the idea of taking a single
trace gas in the atmosphere, accusing it and finding it “guilty of
total responsibility” for climate change, is an “absurdity”.
• Despite activist concerns over CO2 levels, CO2 is a minor
greenhouse gas, unlike water vapor which is tied to climate
concerns, and which we can’t even pretend to control.
• It is claimed the average global temperature increased at a
dangerously fast rate in the 20th century but the recent rate of
average global temperature rise has been between 1 and 2 degrees C
per century, considered within natural rates.
• The IPCC threat of climate change to the world’s species does not
make sense as wild species are at least one million years old, which
means they have all been through hundreds of climate cycles.
• The biggest climate change ever experienced on earth took place
around 700 million years ago.
• The slight increase in temperature which has been observed since
1900 is entirely consistent with well-established, long-term natural
climate cycles.
• Accurate satellite, balloon and mountain top observations made
over the last three decades have not shown any significant change in
the long-term rate of increase in global temperatures.
• Today’s CO2 concentration of around 385 ppm is very low compared
to most of the earth’s history – we actually live in a
carbon-deficient atmosphere.
• It is a myth that computer models verify that CO2 increases will
cause significant global warming because computer models can be made
to “verify” anything.
• There is no scientific or statistical evidence whatsoever that
global warming will cause more storms and other weather extremes.
• Researchers who compare and contrast climate change impact on
civilizations found warm periods are beneficial to mankind and cold
periods harmful.
• The increase of the air’s CO2 content has probably helped lengthen
human lifespans since the beginning of the Industrial Revolution.
• The IPCC alleges that “climate change currently contributes to the
global burden of disease and premature deaths” but the evidence
shows that higher temperatures and rising CO2 levels has helped
[increase the] global populations [and has been associated with less
disease].
• William Kininmonth, a former head of the National Climate Centre
and a consultant to the World Meteorological Organization, wrote
“the likely extent of global temperature rise from a doubling of CO2
is less than 1C. Such warming is well within the envelope of
variation experienced during the past 10,000 years and insignificant
in the context of glacial cycles during the past million years, when
Earth has been predominantly very cold and covered by extensive ice
sheets.”
• Richard Lindzen, Professor of Atmospheric Sciences at
Massachusetts Institute of Technology, wrote: “The notion of a
static, unchanging climate is foreign to the history of the Earth or
any other planet with a fluid envelope. Such hysteria (over
global warming) simply represents the scientific illiteracy of much
of the public, the susceptibility of the public to the substitution
of repetition for truth.”
• A proper analysis of ice core records from the past 650,000 years
demonstrates that temperature increases have come before, and not
resulted from, increases in CO2 by [up to 800] years.
• The “Climate-gate” scandal revealed that [the political]
scientific team had tampered with their own [temperature] data so as
to conceal inconsistencies and errors [and create the illusion of
“global warming”].
Once we cut through the AGW data tampering and falsifications, we see a bigger and more important picture emerging, which is my main two points. These two points are: 1) Global climate change is cyclic, according to actual global climate change history, and not a one-time “global warming linear increasing view” generated by human CO2 emissions of the Industrial Age. 2) For thousands of years historical global climate change has been about cycles of warming and cooling with the more serious negative aspects being associated with global cooling, which could potentially take us into a mini ice age, possibly beginning as early as 2019 and lasting through 2053. The actual documented historical consequences of this mini ice age will be discussed later in this essay.
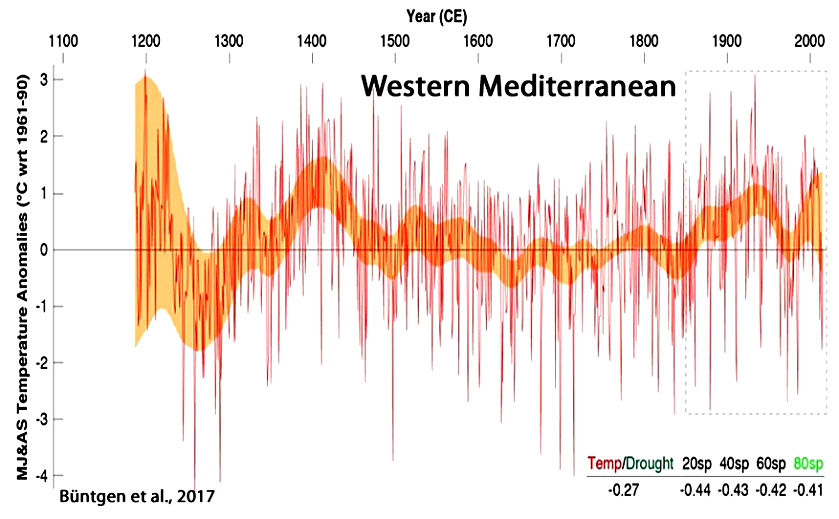
The historical temperature graph (fig. H) from Büntgen, et al. gives us further evidence of cycles of warming and cooling. There is emphasis on global warming showing temperature rises (global warming) in both 1200 and 1400. Temperatures also rise after 1850, peaking in the dust bowl effects of the 1930’s:
 (fig.
H)
(fig.
H)
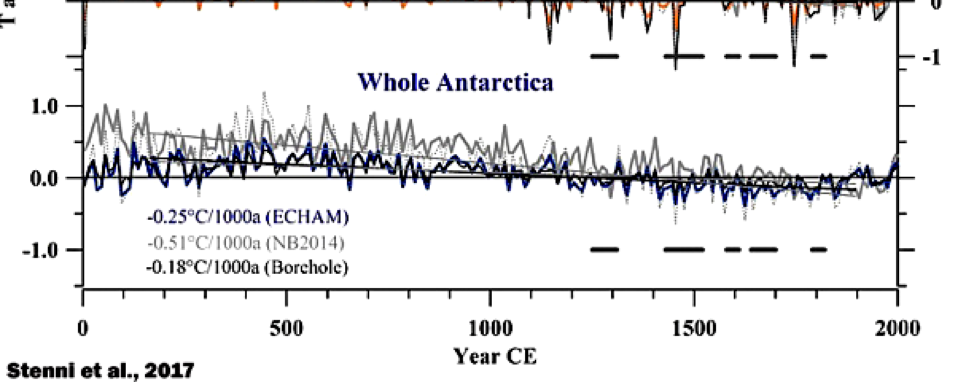
The chart below from Stenni, et al. (fig. I) highlights the slow cooling of the Antarctic from 500 CE progressing through present times showing a progressive cooling trend.
 (fig.
I)
(fig.
I)
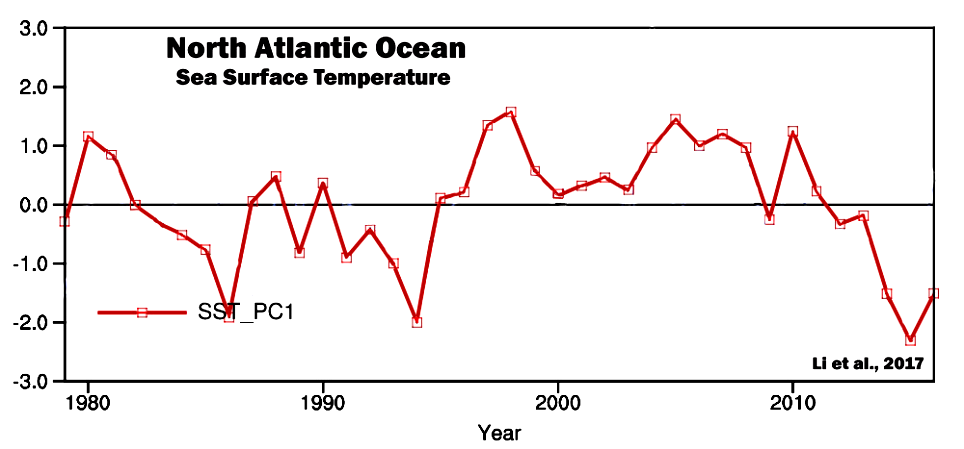
The chart below from Li, et al. (fig. J) shows that although there are graphic surface water changes of ups and downs since 2008, there is a trend of surface water cooling beginning around 2010.
 (fig.
J)
(fig.
J)
Fortunately, not all the data has been tampered with. According to NOAA, sea level is only rising 1.7 to 1.8 mm/year. At that rate, it will take thousands of years for Manhattan to be under water as Al Gore has falsely predicted would happen in 2015. According to NOAA, sea levels at Battery Park, NYC have been rising at about the same rate (2.8 mm/year) since the 1850’s. It is important to note that there is no indication that human industrial activity is affecting the rate of sea level rise. The sea level at Battery Park at the southern tip of Manhattan has been monitored since the 1850s, and has been rising naturally since that time at an average rate of 1.1 inch per ten years, with no sign of acceleration. NASA has also shown that global water surface temperatures have fallen 0.54 degrees C over four months in early 2017. This is the largest drop on record in such a short time.
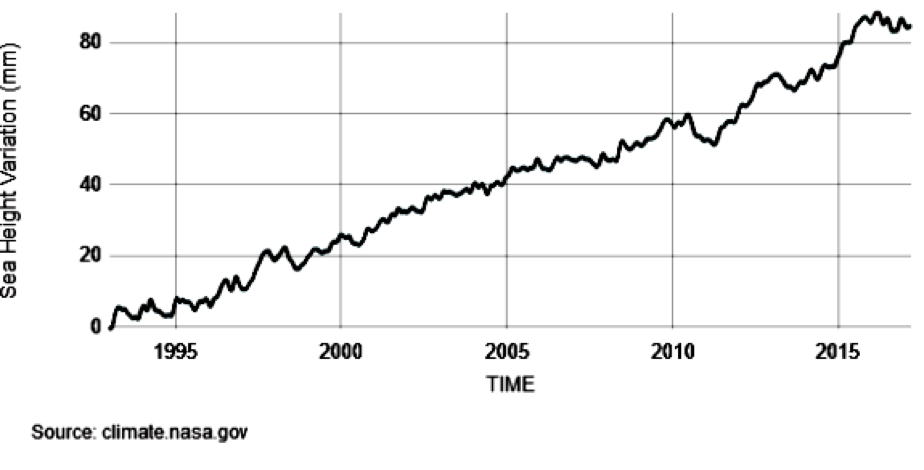
Even the UN’s Intergovernmental Panel on Climate Change (IPCC) only predicts a sea level rise of 59cm (17 inches) by 2100. Al Gore in his Oscar-winning film An Inconvenient Truth went much further, by predicting rises of 20 feet by 2015. He showed computer graphics of cities such as Shanghai and San Francisco half under water by 2100. NASA satellite sea level observations for the past 24 years show that, on the average, sea levels have been rising 3.4 millimeters per year. That’s 0.134 inches per year. This is about the thickness of a dime and a nickel stacked together. These levels, according to many scientists are more within the normal rise, rather than indicating any accelerated rise. This slow rate is drastically below the prediction of twenty feet by 2015 made by Al Gore.
 (fig.
K)
(fig.
K)
In other words, as shown in the graph above (fig. K) from climate.nasa.gov, there seems to be a slow and steady rise in sea level since 1850, but in the last few months in 2017, there has even been a drop in the sea level.
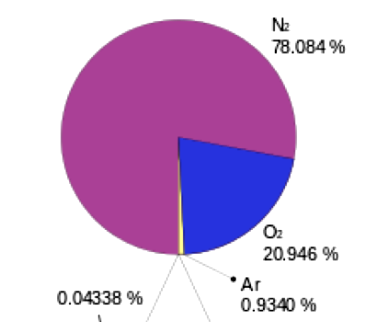
CO2 composes .04% of the atmosphere (see fig. L). Of that .04%, only 3.5% is manmade. The remaining 96.5% of CO2 is naturally occurring. In other words, the man and animal made CO2 is negligible in the actual effect of global warming during the global warming cycle. Below is a chart (fig. L) showing the composition of atmospheric gasses. The CO2 is part of that slight white wedge (0.0438%) at the bottom of the circle, which also includes argon, neon, hydrogen, helium, and methane.
 (fig.
L)
(fig.
L)
Further contradicting AGW climate change theory, historical atmospheric studies show that temperature increases historically have preceding CO2 increases by 800 years. In other words, CO2 increase in the atmosphere is a result of rising temperatures and not the cause of increasing global temperatures.
According to Steven Koonin, who served at the Energy Department as President Obama’s undersecretary for science in the Energy Department and is currently director of the Center for Urban Science and Progress at New York University, “We often hear that there is a ‘scientific consensus’ about climate change…. But as far as the computer models go, there isn’t a useful consensus at the level of detail relevant to assessing human influences.” The point Koonin is making isn’t whether the climate is changing, as, according to Koonin, “the climate has always changed and always will.” Koonin also feels that human additions to CO2 levels have shifted the global warming effect by only 1-2% of the overall greenhouse effect; and the greenhouse effect is a minor causal part of the global warming effect. The main multifactoral causes of global warming include multiple causes such as sunspot activity increases, slight changes in distance between the earth and the sun, volcanoes, cosmic rays, solar system gravitational impact, the tilt of earth’s axis, atmospheric circulation, water vapor, methane, nitrogen from manure, clouds, reflectivity of the earth, forests, soils, and ocean currents and cycles. In other words, global warming forces are multifactoral with CO2 increases playing a small role in relationships to the warming effect and the changing climate system in general. He points out an additional contradiction, which is while the Earth’s average surface temperature has risen .36 to 0.9 degree Celsius over the last quarter of the 20th century, with a slower increase over the past 16 years, the human contribution to carbon dioxide in the atmosphere has gone up by 25%.
Lawrence Solomon writes in the Financial Post “Now an increasing number of scientists are swinging back to the thinking of the 1960s and 1970s.” During this time, as Solomon writes, “The global cooling hypothesis may have been right after all, they say. Earth may be entering a new Little Ice Age.” Columbia University’s George Kukla, who warned the U.S. government about the dangers of global cooling in 1972, postulated that “global warming always precedes an ice age… The warming we saw in the 1980s and 1990s, in other words, was expected all along, much as the calm before the storm.” Cyclic climate temperature change is normal and a key point of this essay is that the big threat we are facing is impending global cooling and not the normal global warming cycle we have just gone through.
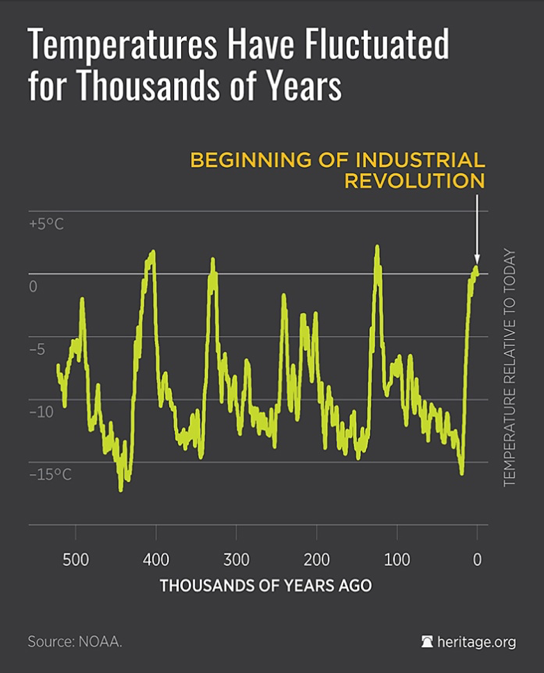
The following graph (Temperatures Have Fluctuated for Thousands of Years), (fig. M), highlights the normal global warming and cooling cycles that have naturally existed before the industrial revolution began.
 (fig.
M)
(fig.
M)
Looking at this graph it should be obvious that natural global warming and cooling cycles have existed for thousands of years. The primary cause seems to be correlative with sun spot activity. My big concern is that we are entering a global cooling phase with an estimated sudden beginning in 2019, which is projected to severely drop temperatures and continue for 33 years. Already the world’s average temperature is 1 degree Fahrenheit cooler than in ’98. As previously mentioned, in 2017, there was even a slight decrease in surface water temperature. In addition, as also previously noted, the North Pole and South Pole ice caps are expanding in size. Recent satellite images show that not only have the Arctic icecaps not melted, but instead they’ve actually expanded in size by 43% to 63%. A Globe and Mail article reported that recently, “An area twice the size of Alaska — America’s biggest state — was open water two years ago and is now covered in ice.”
Global cooling is a potentially destructive cycle, which by 2030 could greatly effect survival on the planet as it has done before in previous mini ice age times. Global cooling in the past has been associated with crop failures, food shortages, people from the northern climates being displaced and moving from cooler climates, such as from New England, to central and lower areas in the USA (warmer climates) around 1815. During the last cycle of global cooling, Canada (a major world breadbasket) and Northern US lost ability to produce food. This could be a major calamity if it were to happen now. This was highlighted by a significant report by the Office of Research and Development of the Central Intelligence Agency in August of 1974. It was titled, “A Study of Climatological Research as it Pertains to Intelligence Problems” (10):
“The western world’s leading climatologists have confirmed recent reports of a detrimental global climate change. The stability of most nations is based upon a dependable source of food, but this stability will not be possible under the new climatic era. A forecast by the University of Wisconsin projects that the earth’s climate is returning to that of the neo-boreal era (1600- 1850) – an era of drought, famine and political unrest in the western world…. Climate has not been a prime consideration of intelligence analysis because, until recently, it has not caused any significant perturbations to the status of major nations. This is so because during 50 of the last 60 years the Earth has, on the average, enjoyed the best agricultural climate since the eleventh century. An early twentieth century world food surplus hindered US efforts to maintain and equalize farm production and incomes…. The University of Wisconsin was the first accredited academic center to forecast that a major global climatic change was underway. Their analysis of the Icelandic temperature data, which they contend has historically been a bellwether for northern hemisphere climatic conditions, indicated that the world was returning to the type of climate which prevailed during the first part of the last century.”
This CIA report further makes the overall point of this essay, which is that we need to seriously prepare for such a situation, which could be a major calamity. This preparation may require your attention. Food preparedness; creating living and growing spaces to withstand the cooling or mini ice age.
Global warming actually has more global benefits than deficits. Global cooling does not. Throughout the history of human life, the Earth’s livability and productivity has always been better when the climate has been warmer than cooler. Human populations have expanded the most when the Earth warmed and turned greener, whether during the middle ages or during the last 2 decades. Whether it is a fish in the ocean, shrimp in an aquaculture pond, or a bean on a vine, things grow faster when it’s warmer. Humans have been quick to take advantage of a warmer climate and to adjust if it gets too warm in an area. More crops grow where it is warm or hot than in frozen ground. NASA satellites show that the Earth is now 6% greener as the world has warmed over the past 20 years: “Our study (NASA) proposes climatic changes as the leading cause for the increases in plant growth over the last two decades, with lesser contribution from carbon dioxide fertilization and forest re-growth”. Furthermore, a May 2007 Nature paper shows that precipitation increases 6.5% per degree C rise, not the 1-3% used in models, making the Earth three times wetter than models forecast. Deserts, as is known from prior warm periods, will be wetter, not drier.
Contrary to global warming myths, global warming has not been associated with more flooding. In 8/31/17, the Journal of Hydrology showed that North American and European flooding averages are in decline; and flooding rates since 2010 are the lowest ever recorded. Floods have been steadily declining since the 1960s. Government studies have also shown that droughts are at a record low. Also, decadal occurrences of tornados, hurricanes, and extreme storms are lower than in the ‘90s. This data is not current enough to include hurricanes Harvey, Irma, and Jose, which do not actually change the long-term trends, but because of them 2017 will be considered an abnormally destructive year. This unique hurricane triad phenomenon has not been reported in previous global warming cycles. During times of global cooling, the number of hurricanes generally increase, so with two of these three hurricanes hitting land, this may even be a warning sign that the global cooling trend has begun. The actual number of forest fires is down, but the number of acres lost to major forest fires is up, (due to national forest fire fighting policy changes).
Five thousand years of written records provide evidence the impacts of sudden dramatic climatic shifts on famines, food shortages, starvation, epidemics, and deaths. Archeologists have identified many Nile settlements preceding the Younger Dryas (an ice age period 11,600 years ago) that didn’t survive the event. The Younger Dryas was period of sharp decline in temperature over most of the Northern Hemisphere of approximately 15 degrees Fahrenheit, which happened over a period of one to ten years. Skeletal remains from this period show an unusually high proportion of the Nile residents died violent deaths (11).
Typically, food, fertility, and population expansion happen during long-term stable warm periods and the opposite during times of global cooling / mini ice ages. During the first, longer phase of the warmer Holocene Climatic Optimum (6000-3800 BCE), the warmer “Atlantic” weather pattern predominated. However, during Sumeria’s cooling period 6,000 years ago, increasing food insecurity and hunger emerged. Clay tablets from this period tell of growing misery, conflict, starvation, and several epidemic outbreaks. In 2170 B.C., archaeological records document a mass exodus from the northern Mesopotamia, linked to global cooling, with settlements abandoned and refugees pouring into southern Mesopotamia. The spread of drought eventually led to the collapse of the Akkadian empire around 2200 BCE. Several thousand years later, on the other side of the world, the Tiwanaku culture in South America faced a similar climate challenge. Between 300 B.C. and A.D. 1100, the Tiwanaku built an urban complex that is estimated to have supported nearly half a million people. They sustained this dense settlement through raised field agriculture, a technique that improved drainage and recycled nutrients in the poor tropical soil. The raised fields of the Tiwanaku may be a good example of a complex society already responding to the challenges of a marginal environment, and therefore vulnerable to sudden climate change. Around A.D. 1100, possibly associated with global cooling, the cities and fields were abruptly abandoned. The fate of the Akkadians and the Tiwanaku raises the question: If a centuries-long drought emerged today, what would we do? During the most severe 7-year period of Europe’s “Great Famine” (1315-1322), there was dire cold weather with incessant rain, floods, and mud. It is estimated that one-tenth of Europe’s population perished from famine during this period. In the Netherlands, England, and Scandinavia the concurrent “grim pestilence” killed one in three people. (12) Similarly, in China, cold conditions in the early 17th century, led to drought and famine. The drought between 1638-1641 was China’s most severe in 500 years. The drought eventually encompassed central-southern China leading to famines and hunger there as well. (13)
Western Europe experienced a general cooling of the climate between the years 1150 and 1460 and a very cold climate between 1560 and 1850 that brought dire consequences to its peoples. The colder weather impacted agriculture, health, economics, social strife, emigration, and even art and literature. Increased glaciation and storms also had a devastating effect on those that lived near glaciers and the sea. The growing season changed by 15 to 20% between the warmest and coldest times of the millennium. That is enough to affect almost any type of food production, especially crops highly adapted to use the full-season warm climatic periods. During the coldest times of the Little Ice Age, England’s growing season was shortened by one to two months compared to present day values. Each of the peaks in prices corresponds to a particularly poor harvest, mostly due to unfavorable climates with the most notable peak in the year 1816 – “the year without a summer.” One of the worst famines in the seventeenth century occurred in France due to the failed harvest of 1693. Millions of people in France and surrounding countries were killed. The effect of the Little Ice Age on Swiss farms was also severe. Due to the cooler climate, snow covered the ground deep into spring. A parasite, known as Fusarium nivale, which thrives under snow cover, devastated crops. Additionally, due to the increased number of days of snow cover, the stocks of hay for the animals ran out so livestock were fed on straw and pine branches. Many cows had to be slaughtered. In Norway, many farms located at higher latitudes were abandoned for better land in the valleys. By 1387, production and tax yields were between 12% and 70 % of what they had been around 1300. In the 1460’s it was being recognized that this change was permanent. As late as the year 1665, the total Norwegian grain harvest is reported to have been only 67 – 70 % of what it had been about the year 1300. With the coming cooler climate in the 1400’s, temperatures became too cold for grape production and the vineyards in southern England gradually declined. (14)
The cooler climate during the Little Ice Age had a huge impact on the health of Europeans. As mentioned earlier, famine killed millions and poor nutrition actually decreased the stature of the Vikings in Greenland and Iceland. Cool, wet summers led to outbreaks of an illness called St. Anthony’s Fire. Whole villages would suffer convulsions, hallucinations, gangrenous rotting of the extremities, and even death. Grain, if stored in cool, damp conditions, may develop a fungus known as ergot blight and also may ferment just enough to produce a drug similar to LSD. (In fact, some historians claim that the Salem, Massachusetts witch hysteria was the result of ergot blight.) In 1484, Pope Innocent VIII proclaimed the existence of witches and echoed popular sentiment by blaming them for the cold temperatures and resulting misfortunes plaguing Europe. His declaration ushered in an era of hysteria, accusations and executions on both sides of the Atlantic. Historians have shown that surges in European witch trials coincided with some of the Little Ice Age’s most bitter phases during the 16th and 17th centuries. In addition to increasing grain prices and lower wine production, there were many examples of economic impact by the dramatic cooling of the climate. Due to famine, storms, and growth of glaciers, many farmsteads were destroyed, which resulted in less tax revenues collected due to decreased value of the properties. Cod fishing greatly decreased, especially for the Scottish fisherman, as the cod moved farther south. The cod fishery at the Faeroe Islands began to fail around 1615 and failed altogether for thirty years between 1675 and 1704 (Lamb, 1995.) Conditions during the Little Ice Age led to many cases of social unrest. The winter of 1709 killed many people in France. Conditions were so bad, a priest in Angers, in west-central France, wrote: “The cold began on January 6, 1709, and lasted in all its rigor until the twenty-fourth. The crops that had been sewn were all completely destroyed…. Most of the hens had died of cold, as had the beasts in the stables. When any poultry did survive the cold, their combs were seen to freeze and fall off. Many birds, ducks, partridges, woodcock, and blackbirds died and were found on the roads and on the thick ice and frequent snow. Oaks, ashes, and other valley trees split with cold. Two thirds of the vines died…. No grape harvest was gathered at all in Anjou…. I myself did not get enough wine from my vineyard to fill a nutshell.” In March the poor rioted in several cities to keep the merchants from selling what little wheat they had left. (15)
During the Little Ice Age, there was a high frequency of storms. As the cooler air began to move southward, the polar jet stream strengthened and followed, which directed a higher number of storms into the region. At least four sea floods of the Dutch and German coasts in the thirteenth century were reported to have caused the loss of around 100,000 lives. Sea level was likely increased by the long-term ice melt during, which compounded the flooding. Storms that caused greater than 100,000 deaths were also reported in 1421, 1446, and 1570. Additionally, large hailstorms that wiped out farmland and killed great numbers of livestock occurred over much of Europe due to the very cold air aloft during the warmer months. Due to severe erosion of coastline and high winds, great sand storms developed which destroyed farmlands and reshaped coastal land regions. Between the early 14th and late 19th centuries, a period of cooling known as the Little Ice Age chilled the planet. Europe bore the brunt of its ill effects, experiencing harsh and fickle weather for several centuries and especially from 1560 to 1660. On the other side of the Atlantic, the year without a summer convinced many New England residents to relocate from colder New England in 1816. Horrified by escalating grain prices and June snowfalls, they settled in the Midwestern United States, providing a boost to the expansion movement that had begun two decades earlier. The combined miseries of hunger, starvation, and outbreaks of typhus and relapsing fever caused many groups to migrate, notably out of grain-starved northeast United States. (16-17)
Famous consequences of global cooling include the Great Famine. Beginning in the spring of 1315, cold weather and torrential rains decimated crops and livestock across Europe. Class warfare and political strife destabilized formerly prosperous countries as millions of people starved, setting the stage for the crises of the Late Middle Ages. Among other military conflicts, the brutal Thirty Years’ War between Protestants and Catholics across central Europe has been linked to the Little Ice Age. Chilly conditions curbed agricultural production and inflated grain prices, fueling civil discontent and weakening the economies of European powers. These factors indirectly plunged much of the continent into war from 1618 to 1648, according to this model. According to reports, some desperate Europeans resorted to cannibalism during the so-called Great Famine, which persisted until the early 1320s. Pestilence and the Black Death can also be correlated with global cooling trends. Typically considered an outbreak of the bubonic plague, which is transmitted by rats and fleas, the Black Death wreaked havoc on Europe, North Africa and Central Asia in the mid-14th century. It killed an estimated 75 million people, including 30-60% of Europe’s population. Some experts have tied the outbreak to the food shortages of the Little Ice Age, which purportedly weakened human immune systems while allowing rats to flourish.
When Spanish conquistadors first introduced the potato in the late 16th century, Europeans scoffed at the unfamiliar starch. In the mid-1700s, however, some countries began promoting the hardy tuber as an alternative to crops indigenous to the region, which often failed to withstand the Little Ice Age’s colder seasons. It soon caught on with farmers throughout Europe, particularly in Ireland. Also in 1816, a meager oat harvest forced many German farmers to shoot their starving horses. The subsequent need for transportation that didn’t require food is thought to have inspired the aristocrat Karl Drais von Sauerbronn to invent his “laufmaschine,” a precursor to the modern bicycle. Data analysis on Europe during the Little Ice Age shows that the additional cooling of 0.2 degrees Celsius during the 17th century (the coldest) accompanied marked declines in harvest and rises in food prices, 100% more famine years, a 1.5 centimeter decline in adult height, 300% more epidemic outbreaks, and a drastic increase in armed conflicts. (18) These epidemics may have been triggered by malnutrition, weakened immunity, hunger-related unrest and mobility, and crowding, in cases of global cooling. A variety of additional impacts arise from social and economic disruptions including malnutrition, infections, and mental disease in climate-displaced groups. Depression and despair wrack failing farm communities and disadvantaged indigenous and other minorities. Tension and hostilities invariably arise with climate-related declines in water, food, timber, and living space. In France, the “year without a summer” following the “supercolossal” Tambora volcanic eruption (Indonesia, 1815), lead to a 2-3 degrees Celsius drop in temperature and a concurrent widespread food crises, starvation, and the overthrow of several minor monarchies. (19) Between 1816-1817 the price of rye increased 2.5-fold in Germany. Food riots occurred in England, France, Belgium, Germany, and elsewhere. Typhus outbreaks occurred in London, tens of thousands died in Ireland from starvation and typhus infection, and in Glasgow much of the population succumbed to these infections, including 3,500 deaths.
Europe and North America were not the only areas affected. Fertility in northeast China, where the cooling and famine were severe, declined by half, whereas in Europe hungry and hostile crowds overthrew leaders. (20) In the first half of the 17th century, famines and floods caused by unusually cold, dry weather enfeebled China’s ruling Ming Dynasty. Unable to pay their taxes, peasants rose up in revolt and by 1644 had overthrown the imperial authorities. Manchurian invaders from the north capitalized on the power vacuum by crossing the Great Wall, allying with the rebels and establishing the Qing Dynasty. During the Eurasian mini ice age (between 1300 and 1850), 881 epidemics were recorded in China. Thirty-two of these affected three or more provinces. During this period, there was a 35% greater probability of an epidemic and a 40% greater probability of a major epidemic than during warming periods. (21)
The climate cooling scare of the 1970s was (and still is) real. It is our responsibility as forward and sustainability thinking humans to study this cycle of global cooling or a mini ice age and decide how to best prepare for it. A major concern is that the cooling may come on rapidly, as it has twenty times previously, and not give us time to adjust once it starts. Based on previous historical cooling cycles, it is advisable to create greenhouse weather protected food growing local gardening areas, stock up on warm clothes and blankets, strengthen the immune system, and carefully consider one’s geographical location.
May everyone be blessed and activated that we look into making safe, thoughtful, and preventative decisions as we go into a potentially cooler future. The key is “be cool” and think ahead.
To your health, sustainability, love, and spiritual growth,
Gabriel Cousens, MD
References:
- Casey, John. Dark Winter: How the Sun Is Causing a 30-Year Cold Spell. Humanix Books, West Palm Beach, FL, 2014.
- http://query.nytimes.com/gst/abstract.html?res=9A01EEDC1239E63BBC4951DFB366838E669EDE&legacy=true
- http://www.chinadaily.com.cn/china/2010-01/22/content_9358854.htm
- http://news.bbc.co.uk/2/hi/americas/8146995.stm
- http://www.pravdareport.com/science/earth/11-01-2009/106922-earth_ice_age-0/
- http://www.theregister.co.uk/2008/08/15/goddard_arctic_ice_mystery/
- http://www.express.co.uk/news/uk/35266/Global-warming-It-s-the-coldest-winter-in-decades
- http://www.zerohedge.com/news/2017-07-15/research-team-slams-global-warming-data-new-report-not-reality-totally-inconsistent-
- http://www.express.co.uk/news/uk/146138/100-reasons-why-climate-change-is-natural
- http://www.climatemonitor.it/wp-content/uploads/2009/12/1974.pdf
- Straus LG, et al. (1996) Humans at the End of the Ice Age: The Archaeology of the Pleistocene-Holocene (Plenum Press, New York), p 50.
- http://www.nbcnews.com/id/3077490/ns/technology_and_science-science/t/how-climate-change-kills-societies/#.WbxLNC-6zVo
- Keay J (2008) China: A History (Harper, London).
- http://www2.sunysuffolk.edu/mandias/lia/little_ice_age.html
- http://www2.sunysuffolk.edu/mandias/lia/little_ice_age.html
- Büntgen U, et al. (2011) 2500 years of European climate variability and human susceptibility. Science 331:578–582.
- Oppenheimer C (2003) Climatic, environmental and human consequences of the largest known historic eruption: Tambora volcano (Indonesia) 1815. Prog Phys Geogr 27:230–259.
- Zhang D, et al. (2011) The causality analysis of climate change and large-scale human crisis. Proc Natl Acad Sci 108:17296-17301.
- Behringer W (2010) A Cultural History of Climate (Polity Press, London).
- Campbell C, Lee J (2010) in Demographic Responses to Economic and Environmental Crises, eds Kurosu S, Bengtsson T, Campbell C (Reitaku University Press, Kashiwa, Japan), pp 107–132.
- McNeill W (1976) Appendix: Epidemics in China (list complied in 1940 by J.H. Cha from the original two volumes of Ch’en Kao-yung’s Chung Kuo Li Tai Tien Tsai Jen Huo Piao). Plagues and Peoples (Anchor Press, Garden City, NY, pp 259-269.