Supplementary Material
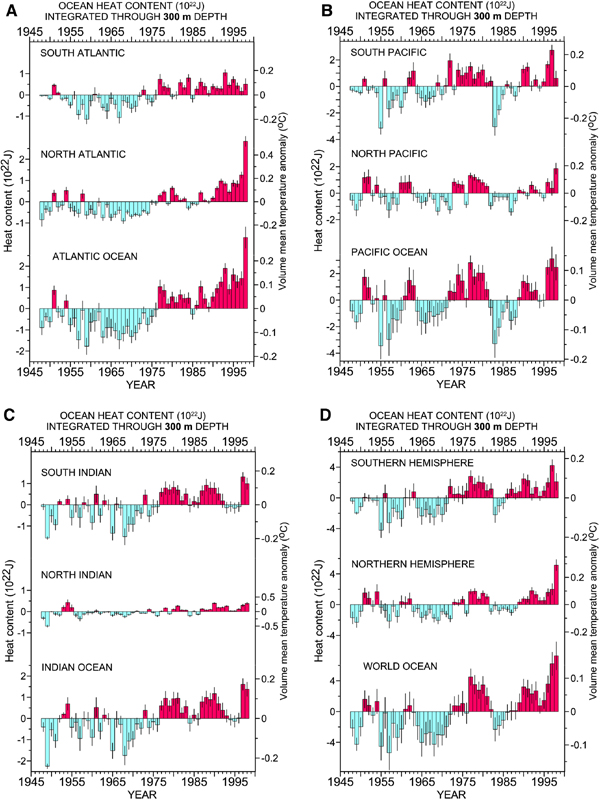
Web Figure 1a. Time series for 1948-98 of ocean
heat content (1022 J) in the upper 300 m for the Atlantic Ocean.
Note that 1.5

10
22 J equals 1
watt-year-m
-2 (averaged over the entire surface of the
earth). Vertical lines though each yearly estimate represent plus
and minus one standard error of the estimate of heat content.
Web Figure 1b. Time series for 1948-98 of ocean
heat content (1022 J) in the upper 300 m for the Pacific Ocean. Note
that 1.5
10
22 J equals 1
watt-year-m
-2 (averaged over the entire surface of the
earth). Vertical lines though each yearly estimate represent plus
and minus one standard error of the estimate of heat content.
Web Figure 1c. Time series for 1948-98 of ocean
heat content (1022 J) in the upper 300 m for the Indian Ocean. Note
that 1.5
10
22 J equals 1
watt-year-m
-2 (averaged over the entire surface of the
earth). Vertical lines though each yearly estimate represent plus
and minus one standard error of the estimate of heat content.
Web Figure 1d. Time series for 1948-98 of ocean
heat content (1022 J) in the upper 300 m for the world ocean. Note
that 1.5
10
22 J equals 1
watt-year-m
-2 (averaged over the entire surface of the
earth). Vertical lines though each yearly estimate represent plus
and minus one standard error of the estimate of heat content.
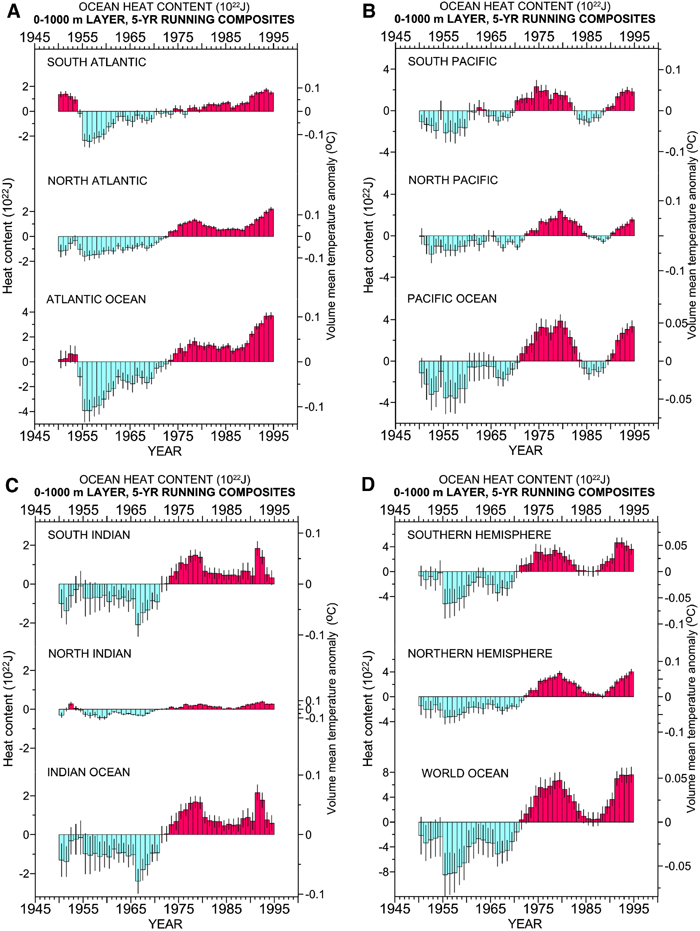
Web Figure 2a. Time series for 1948-98 of ocean
heat content (1022 J) in the upper 1000 m for the Atlantic Ocean.
Note that 1.5 1022 J equals 1
watt-year-m-2 (averaged over the entire surface of the
earth). Vertical lines though each five-year estimate represent plus
and minus one standard error of the estimate of heat content.
Web Figure 2b. Time series for 1948-96 of ocean
heat content (1022 J) in the upper 1000 m for the Pacific Ocean.
Note that 1.5 1022 J equals 1
watt-year-m-2 (averaged over the entire surface of the
earth). Vertical lines though each five-year estimate represent plus
and minus one standard error of the estimate of heat content.
Web Figure 2c. Time series for 1948-96 of ocean
heat content (1022 J) in the upper 1000 m for the Indian Ocean. Note
that 1.5 1022 J equals 1
watt-year-m-2 (averaged over the entire surface of the
earth). Vertical lines though each five-year estimate represent plus
and minus one standard error of the estimate of heat content.
Web Figure 2d. Time series for 1948-96 of ocean
heat content (1022 J) in the upper 1000 m for the world ocean. Note
that 1.5 1022 J equals 1
watt-year-m-2 (averaged over the entire surface of the
earth). Vertical lines though each five-year estimate represent plus
and minus one standard error of the estimate of heat content.
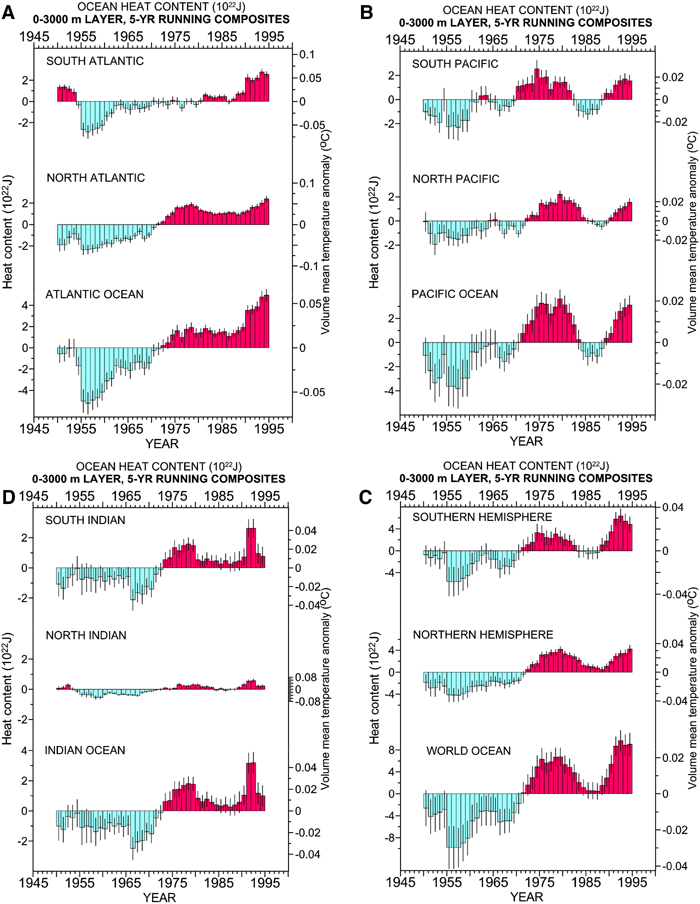
Web Figure 3a. Time series for 1948-96 of ocean
heat content (1022 J) in the upper 3000 m for the
Atlantic Ocean. Note that 1.5 1022
J equals 1 watt-year-m-2 (averaged over the entire
surface of the earth). Vertical lines though each five-year estimate
represent plus and minus one standard error of the estimate of heat
content.
Web Figure 3b. Time series for 1948-96 of ocean
heat content (1022 J) in the upper 3000 m for the Pacific
Ocean. Note that 1.5 1022 J
equals 1 watt-year-m-2 (averaged over the entire surface
of the earth). Vertical lines though each five-year estimate
represent plus and minus one standard error of the estimate of heat
content.
Web Figure 3c. Time series for 1948-96 of ocean
heat content (1022 J) in the upper 3000 m for the Indian
Ocean. Note that 1.5 1022 J
equals 1 watt-year-m-2 (averaged over the entire surface
of the earth). Vertical lines though each five-year estimate
represent plus and minus one standard error of the estimate of heat
content.
Web Figure 3d. Time series for 1948-96 of ocean
heat content (1022 J) in the upper 3000 m for the world
ocean. Note that 1.5 1022 J
equals 1 watt-year-m-2 (averaged over the entire surface
of the earth). Vertical lines though each five-year estimate
represent plus and minus one standard error of the estimate of heat
content.