Water mass transports and transformations in the North Atlantic


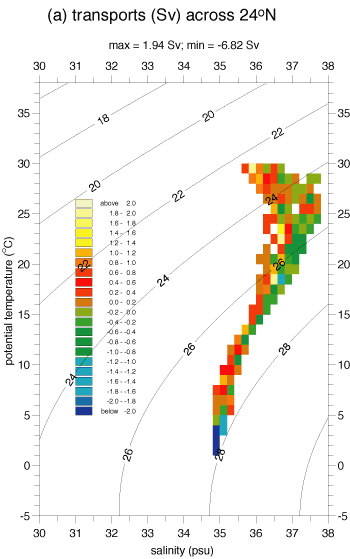
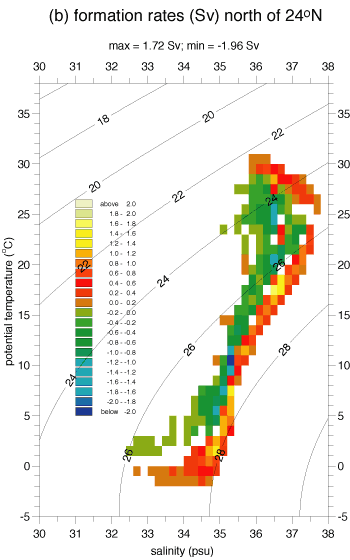
Plots in T-S space of, (a) the transports across 24N (positive polewards), and (b) the water mass formation rates north of 24N, binned in T-S space, both overlaid with sigma0 contours. Larger Figure
In the North Atlantic, large-scale meridional transports can be related to water mass transformation through air-sea heat and freshwater exchange (Marsh, 2000). In a preliminary study we have examined transports across the 24N section, and transformations north of that latitude, of water masses identified by temperature (T) and salinity (S). Transports across 24N, observed on an occupation in late summer 1981, are partitioned into 1 °C x 0.2 psu T-S classes. Plotted in Fig. a, these transports clearly show the poleward flow of warm, salty waters (see red-yellow pixels in the T-S range 18-30 °C, 36-37 psu) and the equatorward return flow of cold, fresh water at high density (see blue pixels in the T-S range 0-5 °C, 34.5-35.5 psu, at sigma0 = 27.8).
We equivalently partition water mass formation rates in the
Atlantic-Arctic region poleward of 24N, based on the SOC climatology of
surface heat and freshwater flux (averaged over 1980-97). Plotted in Fig. b,
these formation rates show how net surface cooling and freshening poleward
of 24N drive water mass transformation in the North Atlantic. Note the
pattern of negative values (blue-green pixels) and positive values
(red-yellow pixels) along the axis of strongest formation rates in Fig. b.
This corresponds to the conversion of warm water towards lower temperature
and higher salinity due to strong cooling and evaporation along the Gulf
Stream. Disparities between Figs. a and b arise due to: (1) mixing of waters
with different T-S in the ocean north of 24N; (2) errors in both the
hydrographic and surface flux data; (3) the unsteadiness in the ocean
circulation (the 1981 hydrographic data may better correspond with surface
forcing prior to that time).
